CAN Bus Telematics at Scale - Fleet Management & Data Lakes
Need to perform CAN bus telematics at scale?
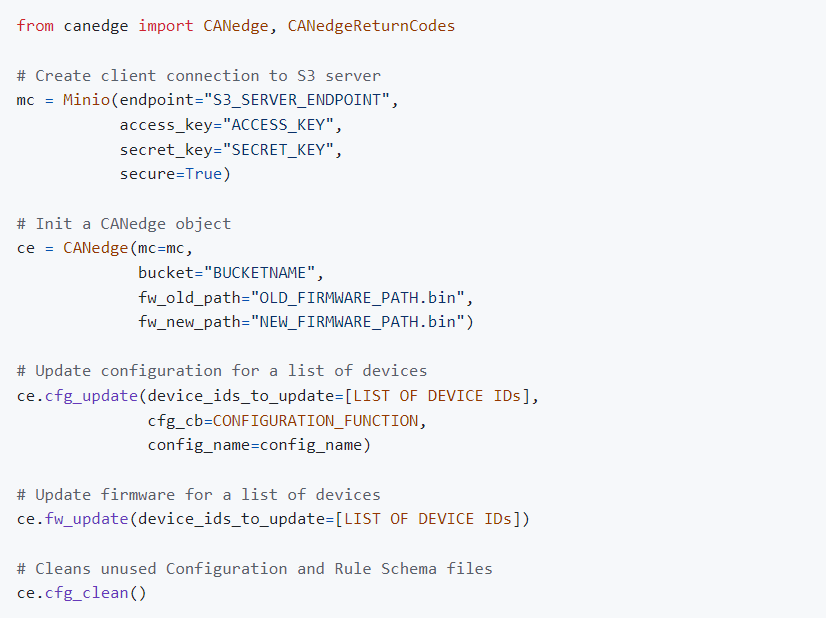
The CANedge lets you record CAN/LIN data to an SD card and push it via WiFi/LTE to your own server. You can easily get started with no consideration of scalability.
But what if you want to deploy a large number of units?
Now scalability becomes important.
In this article, we provide tips for deploying the CANedge at scale. This includes how to manage your device fleet and how to pre-process and aggregate your data. Finally, we explain how you can set up scalable data visualization and scripted analysis.
See also our 1 hour webinar version above!
Teaser: You will e.g. learn about trip summary dashboards like this playground:
In this article
The goal of this article is to provide a holistic perspective of how to manage your CAN bus data logging at scale.
It is particularly relevant for users that deploy many CANedge devices (or aim to do so), but a lot of the subjects are useful as well for small scale deployments if your goal is to set up a streamlined workflow.
Throughout the article we will outline various solution examples, taking outset in our recommended deployment setups. These are generally based on AWS, but we also provide guidance on alternative deployments within Azure, Google Cloud and self-hosted setups.
The article applies to any CAN/LIN related telematics use case, including across higher layer protocols like J1939, OBD2, NMEA 2000, ISOBUS, UDS, CCP/XCP, CANopen and more.
In this article we cover a large number of topics at a high level. All topics are documented in further detail in the CANedge Intro and Docs. If you are unable to find specific documentation, contact us.
How to manage a fleet of CANedge devices
In this section, we focus on how to manage a large fleet of CANedge devices. This involves seven key steps:
- Select server
- Select bucket structure
- Select connectivity method(s)
- Optimize device configuration
- Implement security measures
- Set up commissioning
- Track device fleet status
Below we go through each of these.
This article primarily focuses on large-scale deployments of the CANedge2/CANedge3 devices. Of course, you can also use the CANedge1 in large-scale deployments and some of the topics here will apply to that case as well. However, large scale deployments of the CANedge1 tend to be significantly simpler as they are typically focused on using the device as a 'black box' where each unit is simply installed with an identical Configuration File, recording a rolling window of the last X months of data. If an issue occurs in a specific application, the CANedge1 SD card can be retrieved on a case-by-case basis. Due to the simplicity of this setup, a lot of the topics covered here are less relevant.


1: Select server
The CANedge lets you upload data to your own server, specifically any S3 bucket. This includes self-hosted solutions like MinIO and clouds like AWS, Google Cloud and Azure.
For CAN telematics at scale, we recommend using AWS:
- Scalable: Using a cloud eliminates scalability concerns
- Simple: You completely eliminate server maintenance
- Low cost: Storing data in AWS S3 costs 0.023$/GB/month
- Services: AWS offers many services that are useful as you scale
- Plug & play: Our integrations are easier to deploy in AWS
While we recommend AWS, you can perfectly well use another cloud solution like Google Cloud or Azure.
Many of our users are restricted to using a specific cloud and hence we ensure support across all the major providers. The primary benefit of AWS vs. e.g. Google Cloud and Azure is the fact that we provide a number of automation solutions that can be deployed plug & play within AWS (e.g. Lambda functions) and some integrations that are linked to AWS resources (e.g. Grafana-Athena dashboards). However, equivalents exist in other cloud servers and we refer to these in each of the coming sections.
Some cloud providers like Wasabi offer S3 compatible storage, but limited services on top. For large scale deployments we would not recommend such a solution if your goal is to e.g. deploy automated pre-processing as described later.
Similarly, you can of course deploy a highly scalable setup via open source solutions like MinIO. However, while MinIO S3 is easy to work with at small scale (1-20 units), it can quickly become complex to manage at large scale. Unless you have expertise in this area, we strongly recommend a cloud based solution.


2: Select bucket structure
When setting up your CANedge, you specify an S3 bucket that it connects to. For 90%+ of smaller scale use cases, you should connect all your devices to the same S3 bucket. However, as you scale you may consider the following structural dimensions:
Region: To maximize upload speed, you should create your S3 bucket(s) in regions near the deployment area. If you e.g. have units in EU and US, you can set up a bucket for each region and connect your devices accordingly. However, it is not worthwhile to e.g. deploy a separate bucket for each state/country within a region.
Client: If you are deploying the CANedge on behalf of various clients (e.g. as a system integrator, OEM or similar) you may want to create separate S3 buckets per client. This makes it easier to e.g. enable access to both raw/decoded data on a client-basis, without risking exposure of sensitive data vs. other clients.
Tip: We recommend to stay within 1-10 S3 buckets per 1-1000 devices.
3: Select connectivity method(s)
A key decision is whether to deploy the CANedge2 (WiFi), CANedge3 (3G/4G) - or a mix:
- Ideal if you control the WiFi network(s)
- Ideal for e.g. mining, warehouses
- Avoid LTE data transfer costs
- Complexity if e.g. WiFi changes
- Ideal if no (controlled) WiFi available
- Ideal for e.g. mobile equipment
- Global SIM enables easy management
- Easy to deploy across regions/clients
The CANedge2 is a good fit for large-scale deployments where you have direct control of the WiFi network(s) the device connects to. This can e.g. be use cases like warehouse telematics or mining telematics where vehicles are constantly within range of a WiFi network, or at least periodically come within range of one. Another example can be setups where e.g. a mobile WiFi router already exists in e.g. a vehicle/ship and re-using this via the CANedge2 saves costs. However, if you do not have direct control over the WiFi routers, it can be complex to keep track of e.g. changing router names/passwords in a way that ensures that you can proactively update devices over-the-air prior to e.g. password rotations.
For use cases where there is not a controlled WiFi network available, it is typically necessary to upload the data via 3G/4G. Here, the CANedge3 is recommended as it allows you to insert your own SIM card and directly upload the data without requiring a separate WiFi router. Further, if you use a global IoT SIM card, you can deploy the same SIM and configuration across all devices in your fleet globally, without being concerned about whether a device travels to other countries. The CANedge3 is also optimal for use cases where you are e.g. deploying the device across various end clients (e.g. as an OEM or system integrator) as you can control everything related to connectivity centrally.
You can e.g. use CANcloud to update devices OTA
4: Optimize device configuration
Next, ensure that your devices are configured optimally, in particular:
- Compression: Enable compression to reduce file size by 50% (at no cost)
- Filters: Control what you record and how frequently (often reducing size by 90%+)
- Triggers: Start/stop logging to ensure you only record periods of interest
- Split: Use a split time/size that results in log files of 5-20 MB in size
- Sensor fusion: Enable to drastically improve GPS accuracy in automotives
- RTC sync: Use GPS based RTC sync (if available) for optimal precision
- Advanced bit-rate: Determine if this is required to ensure zero frame loss
The most critical aspect of your device configuration is to optimize your file size. You may decide early on to 'record everything', which is fine. But it is very rare that you need 100% of CAN messages at 100% of the original time resolution across a large number of devices. And if you do, you should as a minimum stil enable compression.
Reducing file size has several trickle-down effects: It reduces data transfer costs (which will be your primary cost driver if you use 3G/4G) and S3 storage costs, while improving your data processing speed.
The split size/time is also relevant to consider at scale. Using too large file splits may cause your average upload speed to decline due to failed transfers starting over from scratch. This means that devices deployed with intermittent coverage may spend significant time attempting to re-upload the same files if they move in-and-out of coverage. On the other hand, too small files also reduce upload speed due to overhead - and will also reduce post processing efficiency. Hence a 5-20 MB range is typically optimal.
If you have a CANedge incl. GPS/IMU, we also strongly recommend to get the full benefits from the GPS. In automotive deployments, enabling sensor fusion can drastically improve accuracy - and will even allow the device to retain a GPS fix (and hence produce all the related data) when it enters areas without any GPS fix (tunnels, parking lots etc). This is particularly important if your analyses e.g. rely on the GPS based speed, trip distance and similar parameters for various calculations.
For use cases where it is critical to ensure zero frame loss, we recommend checking if an advanced bit-rate is required. A practical way to do this is to enable error frame logging for a period to determine if errors occur on the bus even though that should not be the case. If so, you can test alternative bit-rate configurations to ensure you match your CAN bus optimally.
You can of course update the device configuration over-the-air via e.g. CANcloud.
 Learn more in our secure CAN
telematics
intro
Learn more in our secure CAN
telematics
intro
5: Implement security measures
As you scale, it becomes key to secure your devices/data. Below are 5 steps:
- Password encryption: Ensure you encrypt your WiFi/SIM/S3/data passwords
- TLS: Use TLS for secure data transfer from/to your S3 bucket
- S3 device policy: Use our recommended S3 user policies for your devices
- S3 user policies: Create user-specific access rights to your S3 buckets e.g. read-only
- Data encryption: Consider encrypting your log file data
The most critical is password encryption. Otherwise, anyone with physical access to the CANedge may access your S3 bucket. Below are tips for managing encryption:
When you encrypt your device passwords, you can optionally store a 'symmetric key' in the process. This can be used to later perform selective password updates. For example, you may want to perform an S3 secretKey rotation without having to update other passwords (e.g. WiFi passwords). You can store the device serial numbers and symmetric key pairs in a JSON file and ensure it is securely stored.
One important implication of encrypting passwords is that every device Configuration File will become unique. As a result, it can be more cumbersome to update them over-the-air. To get around this, it is recommended to start using the canedge-manager tool as you scale your fleet (typically already at 50+ devices).
This tool allows you to perform updates via the command line or Python scripts. This lets you make highly tailored Configuration File updates (e.g. changing select fields) in a robust and secure manner. It also enables you to automate the password encryption, which can otherwise become a time-consuming step at scale.

6: Set up commissioning
To speed up your deployment, we can offer to add your custom Configuration File and TLS certificates during production at fair minimum order quantities (MOQ). This step can include encryption of passwords.
This way, your devices can immediately connect to your S3 bucket out-the-box.
Note that you may want to avoid sharing your 'production' S3 bucket credentials with us. In such a case, you can instead provide a Configuration File that allow the devices to connect to a separate 'commissioning' bucket. When your devices initially connect to this S3 bucket, you can then run scripts manually (or via e.g. AWS Lambda functions) to perform an OTA update of the device Configuration File, so that the device migrates to your 'production' bucket.
You can use CANcloud to monitor device status
7: Track device fleet status
At scale it is vital to keep track of devices in the field. For the first 1-100 units, this can be done 'manually' via the CANcloud status dashboard, which provides a quick overview of any potential issues such as SD storage accumulation or unexpectedly long delays since the last heartbeat of a device.
At 100+ units, you may want to supplement CANcloud with script-based tracking and alert systems. This can be implemented easily with the S3 API.
Backend: Big data pre-processing
Next, we focus on how to pre-process your CAN/LIN data.
Here we refer to the process of DBC decoding the raw data and outputting the result in a format ready for visualization and analysis, e.g. a database or data lake.
Why is data pre-processing relevant?
At scale you will often want to pre-process uploaded log files:
- Separates the timing of data processing vs. analysis
- Required for compatibility with most tools
- Helps avoid duplicate processing
- Enables immediate data interpretation e.g. for alerts

Once you have deployed your CANedge units, your server will receive a steady inflow of uploaded log files containing raw CAN/LIN data. In rare use cases this may be the 'final form' that your data needs to be in for consumption, but most often the data needs to be pre-processed.
The obvious reason is that most analysis focuses on DBC decoded parameters like speed, GPS position, temperatures etc. - rather than raw CAN/LIN frames. By DBC decoding the data, we make it more easily accessible for such analyses and many tools will only be able to work with the data in decoded form.
In principle this could be done on-the-fly: If a user wants to analyze DBC decoded data from period X to Y, he could perform both the data fetching, loading, DBC decoding and visualization in one step using tools like Python or MATLAB. However, for CAN/LIN telematics, the sheer volume of data involved will typically make this prohibitively slow.
As an example, a use case may involve a single device that uploads 30+ GB of raw CAN data per month including 500+ different signals packed in raw CAN frames. If you want to just determine the average value of one signal (e.g. speed) over the last 1 year, your script would need to download 360 GB of data and process it. As you can imagine, this would be a cumbersome way to work.
Here, pre-processing serves the purpose of performing the decoding of the data in a separate, automated manner and storing the results in a way that makes them very fast to query for later analysis.
We recommend to consider early on how the decoded data will be used - in particular related to the below challenges:
- How to stay frontend agnostic? You need to plan which software/API tools will be used in consuming the processed data - but also incorporate interoperability as you cannot predict everything. In particular, be careful to avoid data duplication.
- How to store your processed data? You should consider how to best store your processed data, balancing factors like the cost per GB per month vs. how 'hot' the storage has to be for ensuring sufficient data retrieval speed
- How to manage your data life-cycle? Will you need to store data indefinitely, or is your data e.g. irrelevant once it is X weeks/months/years old? Should the retrieval speed be identical across the life-cycle?
- How critical is the query speed? How fast should you be able to query the decoded data? And how is this affected by whether you need to visualize a couple of trips from a single device - vs. advanced historical multi-device statistical analyses?
- How large a share of the data will be used? Will you need to pre-process 100% of your data in order to perform e.g. aggregated statistical analysis - or will you only need to access a small %-share on a case-by-case basis?
- How to enable secure access to relevant users? Who will need to be able to view /process/edit the data - and how will this affect the data structure, privacy and security?
Solution example: Automation + Parquet data lake + interface
Most large-scale data pre-processing requirements can be achieved via the below workflow:
- Automate: DBC decode uploaded data via Lambda functions
- Store: Store the results in an S3 Parquet data lake
- Interface: Deploy the Athena SQL query interface
See the CANedge Intro for step-by-step deployment.


1: Use AWS Lambda to automate pre-processing
We recommend to use AWS Lambda functions to process log files uploaded from your CANedge fleet to AWS S3:
- Easy-to-deploy: We provide a plug & play solution for deployment
- Automatic: The Lambda will auto-process every log file upon upload
- Immediate: Processing is without delay, enabling near real-time use cases
- Serverless: You only pay when data is processed
- Scalable: The setup auto-scales up with your use case

In our recommended work flow, you can use our pre-defined Lambda function to process your incoming data. To deploy this, you can use our AWS CloudFormation template, which lets you deploy a set of pre-defined resources in your own AWS account, including the Lambda function, relevant user policies, an S3 output bucket for storing the results etc.
The Lambda function leverages our MF4 decoder tool, which can DBC decode raw MDF log files from the CANedge using provided DBC files and output the results as Parquet files. To provide the Lambda function with your own DBC files, you upload these into your S3 input bucket, allowing the Lambda to fetch them every time a new file is to be processed.
The Lambda script will upload the resulting Parquet files into another AWS S3 bucket referred to as the S3 output bucket - aka the S3 Parquet data lake described below.
Our guide also explains how you can handle advanced use cases that involve conflicting device-specific DBC files, relevant if you e.g. have multiple different vehicle models uploading data to the same S3 bucket. Here, you can provide a JSON file for explicitly specifying the DBC file(s) to be used per device.

2: Store DBC decoded data in S3 Parquet data lakes
For most large scale CANedge use cases you need to store terabytes (TB) of DBC decoded data. At the same time, the data is often consumed by a small group (e.g. an internal team of OEM engineers) on an ad hoc basis.
This makes AWS S3 Parquet data lakes ideal for storing the decoded CAN/LIN data:
- Low cost: Data lake storage is up 95% lower cost vs. using a database
- Interoperable: You can easily query the data via Python/MATLAB or 'interfaces'
- Efficient: Data can be queried extremely fast, despite the low cost
- File based: Storage is file-based, making it easy to understand and modify

The CANedge is first-and-foremost a data logger, storing raw CAN/LIN data in binary MDF files in a specific folder structure. Similarly, a Parquet data lake is just a collection of binary Parquet files stored in a specific folder structure. And like the CANedge MDF files, the Parquet files can be stored and used locally or on S3. This offers an intuitive symmetry between the raw MDF files and the Parquet data lake. Naturally, there are many options for storing the DBC decoded data: MDF data lakes, CSV data lakes, databases etc. However, the Parquet data lake offers the best combination of tool support, compression, reading efficiency and ease-of-maintenance.
The practical creation of the Parquet data lake is done via our MF4 decoder tool. This takes as input the raw CANedge MDF log file(s) and your DBC file(s), then outputs a separate Parquet file for each device CAN message. The files are automatically stored in a date-partitioned folder structure, which enables you to read out a specific CAN message on a specific date - without extracting unrelated data.
When the decoding is done in an AWS Lambda function, the Lambda Python script effectively just serves as a bit of wrapping around the MF4 decoder to e.g. fetch the required MDF/DBC files from the S3 input bucket, execute the decoder tool and upload the results to the S3 output bucket.
It is important to note that the CANedge MF4 decoders do not introduce any form of resampling of the data when creating the Parquet files from the raw MDF files. This is vital because it means that the decoding is 'lossless' - every CAN message is decoded into a separate table with a separate time raster.
One downside to using Lambda functions to process incoming log files is the fact that every log file is processed in isolation. This is generally irrelevant if a single log file roughly represents e.g. a power cycle or trip.
However, if you're creating a very large number of log files per device per day (for example via 10 second splits), you drastically reduce the efficiency of your data lakeas e.g. tools will have to process data across a vast number of files. For intra-day queries from a single device this is negligible, but if you e.g. need to perform historical queries across months of data or several devices, the processing time increases dramatically.
In such cases, it is recommended to perform a periodic 'compaction' of the data in order to concatenate log files that belong together (e.g. in a single power cycle) to the extent possible. The simplest way of achieving this is to periodically delete your entire data lake (or at least the non-compacted sections) and perform a batch processing of your historical log files via our MF4 decoders. In doing so, the MF4 decoders will automatically concatenate log files to the extent possible, enhancing your query speed substantially.

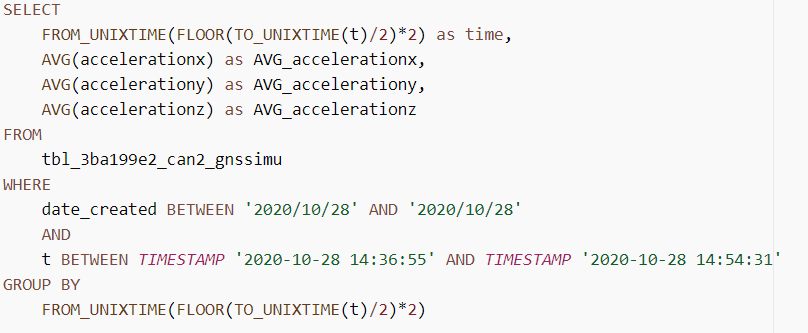
3: Interface with your S3 data lake via Amazon Athena
You can work with a Parquet data lake 'directly' using e.g. Python/MATLAB. However, for most use cases you will also want to add an 'interface'.
An interface lets you query your data lake via e.g. SQL, efficiently processes the data in the backend - and returns the query results. We recommend using Amazon Athena:
- Easy-to-deploy: We provide a plug & play solution for deployment
- Low cost: With Athena you pay only for the data scanned (5$/TB)
- Fast: Extract insights across GBs of data in seconds
- Interoperable: Athena vastly expands the integrations for your data lake
- SQL: Use standard SQL queries to interface with your data

Just like for the Lambda function automation, we provide a plug & play solution for deploying Amazon Athena in your own AWS account via AWS CloudFormation templates. This lets you set everything up in a few minutes.
Part of the deployment is another service in AWS called AWS Glue. Here, a script is set up that 'maps' your AWS S3 Parquet data lake so that Athena understands the structure (i.e. the folder hierarchies) and the Parquet file schemas (i.e. the structure of the Parquet files). This script can be run ad hoc when new devices or CAN messages are added to the data lake (it does not need to run when new log files are added without affecting the folder structure).
You can use the Athena SQL query interface directly within AWS or via the S3 API (available for all major programming languages). The latter is useful in e.g. custom web app development or statistical analysis. In addition, many visualization tools support Athena as a data source, e.g. Grafana or Tableau. Athena can also be used as a data source through the available ODBC driver, enabling e.g. integration in Excel, PowerBI and more.
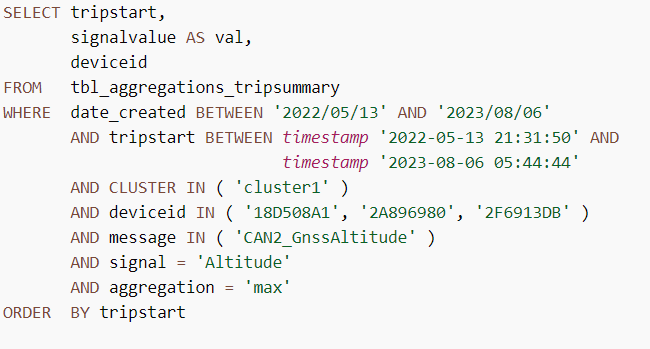
Athena lets you query your AWS S3 Parquet data lake via SQL queries. Below is an example of how these can look:
Alternative pre-processing workflows
The above workflow is suitable for most large scale use cases in AWS. Below we outline alternatives and variations:
As previously discussed, AWS is our default recommended cloud solution for use with the CANedge2/CANedge3. This also means that we offer a number of plug & play solutions for deploying the above workflow within AWS.
With that said, you can set up very similar data pre-processing workflows in other clouds:
Azure: Within Azure, you can use Azure Functions as an alternative to Lambda functions. Further, you can store your DBC decoded Parquet data lake in an Azure container, similar to how you can store it in an AWS S3 bucket. From here, you can query the data via Azure Synapse Analytics serverless SQL pool endpoints with a similar pricing/concept as Amazon Athena (see the CANedge Intro for step-by-step deployment). You may also consider leveraging Microsoft Fabric going forward for this setup.
Google Cloud: Google Cloud Platform (GCP) offers an equivalent data pre-processing workflow. Data from the CANedge can be uploaded directly into Google Cloud Storage (GCS) buckets via the S3 interoperability. You can then deploy Cloud Functions that are triggered by the upload and serve the same role as Lambda functions. The results can be output in another Google Cloud bucket. Finally, you can use Google BigQuery to interface with your Parquet data lake. See also our intro on Grafana-BigQuery for details.
Self-hosted: You can of course also deploy a similar work flow on a self-hosted server. For example, you may have set up a MinIO S3 input bucket for receiving log files from the CANedge2/CANedge3. Here, you can deploy MinIO Object Lambda to automate your pre-processing and output the Parquet files to another MinIO S3 bucket. You can then e.g. use the open source ClickHouse interface as an alternative to Athena for querying the data. You can find details on deploying ClickHouse in the MF4 decoder Docs.
In other words, the deployment is not unique to AWS - but it requires a bit more work to set up in Azure or GCP. For a self-hosted deployment, you should expect significantly more effort in order to set up the equivalent workflow and it can be particularly complex to do so in a scalable way.
You may want to integrate the data into your own platform/system. Here, the data lake approach may still be applicable if your end destination platform integrates with Parquet data lakes (either directly or through an interface like Athena). Alternatively, you can directly inject data into your custom platform by modifying the Lambda function script. For example, you can adjust the script to skip the uploading of Parquet files to S3 - and instead load the data into dataframes and write it to your preferred platform destination endpoint using the relevant API. In the CANedge Intro you can find example scripts for modifying your Lambda function to write your decoded data to an external database via REST.
As discussed previously, you may not need to process all of the incoming data - but instead only process log files case-by-case. Here, we do not recommend deploying the Parquet data lake workflow, but instead we suggest using more basic desktop GUI tools. For example, you can use CANcloud to browse your way to the relevant data in your S3 bucket by leveraging CANcloud's ability to show the recording start time of uploaded log files directly. Once you've identified the relevant group of files, you can download them and load them in tools like asammdf, Vector CANalyzer or PEAK's PCAN-Explorer.
Alternatively, you can mimic the Parquet data lake workflow, but tweak it so that you only process relevant files. The simplest way to do this is to create a new 'ad hoc' S3 input bucket that is separate from your 'main' S3 input bucket (where your CANedge2/CANedge3 devices are uploading files). You then deploy the Parquet data lake integration as if the separate S3 input bucket was your main bucket. This way, you can manually download relevant log files from your main S3 input bucket and upload them to your ad hoc S3 input bucket. The Lambda function will then process the manually uploaded log files, outputting them into an S3 output bucket Parquet data lake. This way you can leverage all the data lake integration options - while only using it on relevant data.
Backend: Event detection & notification
Next, we consider event detection, i.e. the process of identifying specific CAN/LIN signal events in your data such as speeding, harsh braking, high temperatures, active DTCs etc.
For details, see our event detection article.
Why set up backend event detection?
Event detection is often vital in CAN/LIN telematics:
- Auto-evaluates 100% of your data
- Super charges diagnostic analysis
- Enables immediate notification/reaction
- Basis for browsing data by events

Solution example: Custom Lambda + SNS topics + event Parquet files
If you have deployed the previous pre-processing workflow, event detection can be added as below:
- Detect: Detect events within modified Lambda function
- Store: Store detected events in your S3 Parquet data lake
- Notify: Use SNS topics to notify subscribers of events
See the CANedge Intro for step-by-step deployment.

"event_name": "HighSpeedAlert",
"messages_filtered_list": [["CAN9_GnssSpeed"]],
"trigger_signals": ["Speed"],
"lower_threshold": 20,
"upper_threshold": 22,
"rising_as_start": True,
"exact_match": False,
"raster" : "0.2s"
}
1: Detect events via custom Lambda function
You can easily modify your Lambda to detect events:
- Unzip your Lambda code and add our plug & play event detection script
- Define your events as a list of 'event objects' in the script
- Update the default Lambda function with your modified version
The default Lambda function will DBC decode your incoming log files to create a 'local' Parquet data lake within the Lambda environment. As the final step in the Lambda code, this local data lake is uploaded to your AWS S3 data lake.
In the CANedge Intro, we provide an event detection function that you can use to add an extra step to the default workflow. Specifically, the function lets you define a list of 'event objects' (see the example) that the function can use as the basis for evaluating the local Parquet files.
Importantly, the event detection thus works as an additional layer to the default pre-processing behavior - and you therefore still get all the benefits discussed in the previous section. Further, the event detection function is designed to allow you to focus on defining your events via the pre-defined structure - rather than doing any custom coding. At the same time, if you wish you can of course freely modify the default script behavior if you prefer.
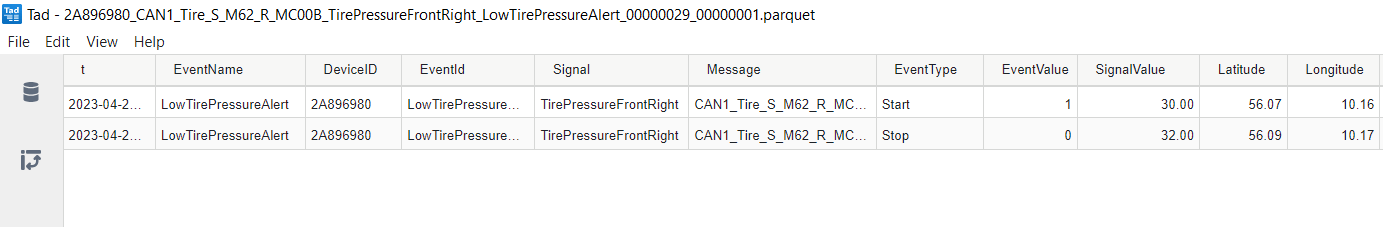
2: Store event data as Parquet files
The event detection script also stores detected events in your S3 Parquet data lake. As a result, you can easily query historical events through e.g. the Athena interface.
Within the modified Lambda, the detection of an event will result in the creation of a new Parquet file with event-specific meta data. This Parquet file will be uploaded to the S3 data lake along with your regular Parquet files and can be queried via Amazon Athena, or e.g. fetched through Python/MATLAB.
The event Parquet files are stored in an aggregations/ folder of your S3 data lake across all devices/messages. As a result, you will be able to construct very simple queries to extract information across any number of devices and event types.
As explained in the pre-processing section, you can easily process a backlog of historical data to ensure your S3 data lake contains a full depiction of your recorded data.
Of course, you can also do this with the modified event detection function. In fact, it is highly recommended that you start out with a local deployment of your event detection routine, as this will allow you to test the specific event objects you design to identify issues or e.g. excessively frequent detection. By deploying the setup locally, you can also easily process an entire backlog of historical data to extract event information, which you can then add to your S3 Parquet data lake
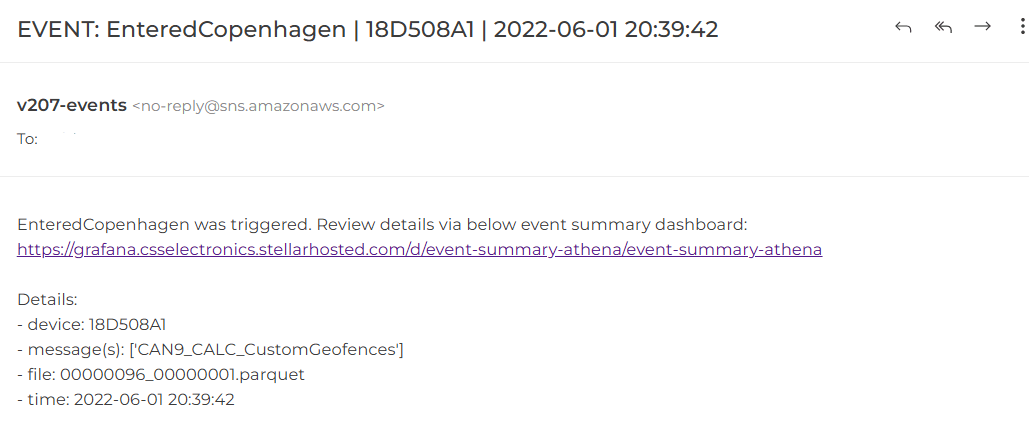
3: Notify SNS topic subscribers of events
Finally, the script also publishes messages to an AWS SNS topic when events are detected - allowing subscribers to receive immediate email/SMS alerts and react accordingly. The subject/body can be modified if required.
When you deploy the default pre-processing work flow via AWS CloudFormation, an event SNS topic is also deployed in AWS and you will be asked to provide a subscriber email (this can be edited later). This allows the Lambda to easily publish messages to the SNS topic, which will then result in email notifications being sent to the subscriber(s). When you deploy the event detection function, the script will publish a message to your event SNS topic when an event is detected, enabling a simple notification workflow.
Importantly, you can change subscribers and notification methods (email, SMS, ...) within the SNS topic settings, rather than via the Lambda - which makes it easier to manage at scale. Of course, if you decide to enable SNS topic notifications, it is important that your event objects are designed in a way so as to avoid 'spamming' your subscribers with alerts.
Backend: Data aggregation and meta information
In this section we outline why (and how) you might add an extra step to your backend procesing: Data aggregation.
Why perform data aggregation?
Through pre-processing, you can create a Parquet data lake split by devices and CAN messages. This structure is ideal for extracting data from a specific device-message in a single query.
However, the data lake structure does have limitations:
- It is impractical to extract cross-device results in a single query
- Extracting results across e.g. 100 GB remains time consuming
- It is non-trivial to extract results at a trip-by-trip level
These come into play if you are e.g. trying to do cross-device benchmarking, long-trend statistics or trip-by-trip analysis.
Here data aggregation is useful: Supplement your data lake with select resampled results that are quick and easy to query.

It can be a bit unclear how to distinguish data pre-processing vs. data aggregation.
In our view, a key distinction is whether you are reducing the richness of the data or not:
When you perform data pre-processing, you are DBC decoding the data and writing the results to Parquet files. Notice here that no information is lost: You retain the full timestamp resolution and all messages/signals can be included in the Parquet data lake. In other words, you will be able to rely purely on the pre-processed data in your analysis, with no need to refer back to the original raw log files.
In contrast, when you perform data aggregation, you are deliberately resampling the data in order to create a summarized view of the results. The resulting aggregated data will rarely suffice in itself, meaning that it should be viewed as a supplement to the regular pre-processed data, not as a replacement.
Deploying data aggregation presents a number of challenges:
- How to decide on relevant data/structure? You need to decide what CAN/LIN signals you wish to aggregate (e.g. RPM, speed, calculated signals, ...), in what way (avg, sum, min, max, ...) and to what level (devices, trips, days, ...)
- How & when to aggregate the data? Consider what scripts/tools to use, where to deploy the processing, how frequently to run it (e.g. daily, weekly, ...), how to automate it - and how to manage this effectively.
- How to maintain data integrity? When aggregating data across devices and time, you lose information. Your aggregation outputs should retain data integrity and enable further (valid) aggregations/comparisons across devices and time
- How to add meta information? You may need to enrich your aggregated data with relevant meta information, either based on the CAN data or external databases. Consider how this can be incorporated in a systematic and automated way
- How to store/access the output? The aggregated data should be stored in a way that enables seamless integration with other pre-processed data, as well as any dependant frontend tools
- How to manage structural changes? Aggregation can be costly and redoing it should be minimized. Expect changes to be made in e.g. required parameters - and incorporate the necessary flexibility into your design of the aggregation outputs
Solution example: Python aggregation + Parquet trip summary table
Following the last section, we assume that you have deployed Lambda automation, an AWS S3 Parquet data lake and Athena. If so, below provides a simple way to deploy data aggregation.
See the CANedge Intro for step-by-step deployment.

1: Deploy Python-based data aggregation
In brief, the deployment works as follows:
- Upload a JSON with details on which signals to aggregate (and how) to S3
- Upload our aggregation Python script to S3
- Set up AWS Glue service to run the script on a daily schedule
The script performs an automated daily aggregation of your S3 Parquet data lake and outputs the results in a new 'trip summary' Parquet file in your data lake.
To enable easy data aggregation across use cases, we provide a general-purpose Python script. The script relies on a JSON file that serves as the 'configuration' and specifies which devices to process, what signals to extract from which messages - and how to aggregate these signals. This information can be easily entered by the users in the JSON file with no coding knowledge required (although you should have a basic understanding of how to enter information in JSON files).
The script is deployed in AWS Glue, which is the service that is already deployed if you are using Amazon Athena (it performs the mapping of your data lake as required by Athena). AWS Glue can be used as a simple service for running Python scripts within AWS, ensuring that you minimize latency and avoid egress fees (i.e. transferring data out of AWS, which is costly).
From a technical perspective, the script uses the S3 API (boto3) and a Parquet API (pyarrow) to go through the relevant parts of your data lake. By default, the script is intended to run on a daily basis, meaning that the script only needs to process the past day's worth of data. However, you can easily modify this to e.g. process all your historical data or a specific period.
When the table is created the first time, you can map it as part of your data lake via the other AWS Glue job, enabling Athena to query the trip summary data. Since this table goes across devices and messages, you will only need to map the table once, regardless of any future modifications made to the table.
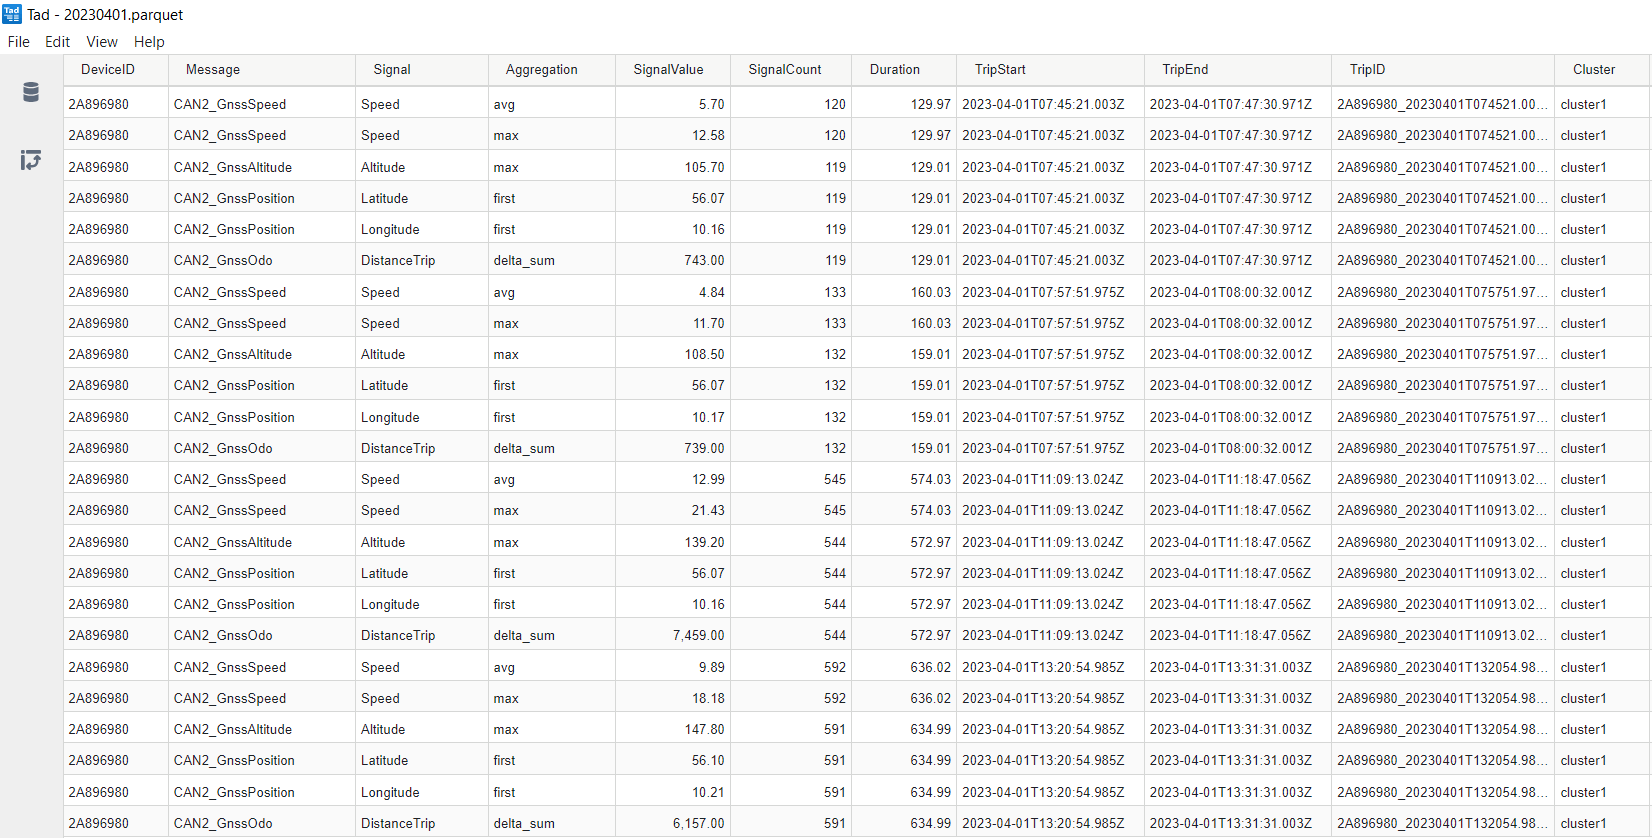
2: Store results in Parquet 'trip summary' table
The resulting Parquet table provides a trip-by-trip aggregation of your data and is structured as per the picture.
The table can be used as a supplement (not replacement) to your existing data lake and provides multiple benefits:
- Scalable: Extract trip results in seconds across thousands of devices
- Simple SQL: Extract any of your aggregated data via a single, simple SQL query
- Filters: You can use SQL filters to easily extract subsets of interest
- Partitioning: Date partitioning enables efficient queries
- Flexible: Add/remove signals without breaking the Parquet schema
- Trips: Trip aggregation provides suitable granularity for most macro analyses
- Restructure: Easily restructure the table in-query to e.g. pivot the data
- Link: Easily 'link' to the full-resolution data lake via the device ID and trip start/end
The script we provide by default defines a trip based on a 'trip identifier' message (e.g. one containing Vehicle Speed or similar reasonably high-resolution message). The script then identifies 'trip windows' for a given device/day, with a window corresponding to a period of >1 min with <10 min between two observations. You can of course modify this as you see fit.
For a given trip period, the script will add an entry to the output table for every signal aggregation you define via the JSON file we provide. For example, you can add the signal Speed from the message CAN2_GnssSpeed and specify the aggregation type as 'avg' to get the average returned.
The script by default provides multiple popular aggregations like min/max/avg/median/first/last as well as e.g. delta_sum, delta_sum_pos and delta_sum_neg, useful in aggregating parameters like e.g. consumed State of Charge over time. You can add further aggregations if needed.
You can of course add your own aggregation values, or even signal calculations, within the script. For example, you can add a custom aggregation type that checks if a signal exceeds a specific threshold for more than X seconds - and returns 0 or 1 depending on the result. However, if you need to add calculated signals across separate messages (i.e. with separate time rasters), it is recommended to do so separately from the data aggregation script.
The table structure will not necessarily benefit from the full efficiency of the Parquet file format (for technical reasons). On the other hand, this is compensated through the fact that the aggregated table will be extremely light weight.
For example, if you have 500 devices with an average of 10 trips per day and 20 signal aggregation entries across 1 year, the above structure would result in 365 separate Parquet files (due to the date partitioning), each containing 100,000 rows. An interface-based SQL query (e.g. from Athena) on this table would return the requested results in 2-4 seconds in our tests.
Trip aggregation is particularly powerful if your underlying Parquet data lake contains high-frequency data (for example if you have recorded your CAN data with no prescaling). Here, your underlying data lake can quickly become very dense, with a single device e.g. containing 100+ GB of data across a single year. In such situations, performing analytics on the non-aggregated data lake can become slow - in particular across devices.
When aggregating data, be conscious about how you interpret the data. For example, let's say you are interested in the average speed of your vehicles and you therefore extract the average speed across all devices at a trip level.
Next, you intuitively wish to get the 'average speed per device' for a given period and thus take the average speed across the relevant trip averages. However, this will result in the average vehicle speed per device per trip - not the overall average. Effectively, you are assigning equal weighting to each trip, whether a trip lasted 5 hours or 1 minute.
One way to address this is to leverage the fact that the trip summary table includes the 'duration', which you can use to perform weighted averages when aggregating across trips.
Another example is GPS positions: If you want to get an idea of the location of each trip, it makes sense to include aggregated Longitude/Latitude signals. But taking the average of these may not be a good idea as you essentially get 'meaningless' positions that do not reflect the actual trip route. A better solution can be to take the 'first' observation of each, thus letting you visualize the trip starting positions.
Some signals can only be aggregated in a meaningful way if you first calculate the delta values. For example, let's say you wish to understand how much State of Charge is consumed per trip, but you only have the absolute State of Charge signal available. In such a case you can use the 'delta_sum_neg' aggregation to calculate the change in State of Charge and ignore positive changes (e.g. related to charging events). The result will be a clean variable that you can also aggregate across trips.
Alternative data aggregation solutions
You can also consider one of the below alternative data aggregation workflows:
The aggregation Python script is designed so that it can be deployed anywhere (incl. locally) and target either a locally stored data lake, or one stored on S3. As a result, you can also deploy it for setups outside AWS with minimal modification.
Locally, you can automate the script execution via e.g. a CRON job or task scheduler. In the Azure environment you can consider using e.g. Azure Data Factory, while in GCP you may consider e.g. Google Cloud Dataflow.
If you are primarily going to use e.g. Python/MATLAB to analyse your Parquet data lake, it may be less vital to perform the periodic data aggregation. This is because scripts allow you to circumvent a lot of the limitations outlined for the data lake structure.
For example, if you wish to extract the average speed across 50 devices for a given time period, you can do so easily in a loop - in fact that is exactly what our Python aggregation script does in the first place. It simply uses the S3 API and pyarrow to loop through relevant folders/files in the Parquet data lake, aggregating the results. Similarly, you could also do the same with Athena queries in Python using the Athena API. Here, you can then write a simple query for a single device/message - and simply adjust the parameters of that query as you loop through a list of devices/messages.
As such, the primary value of doing separate data aggregation in this scenario is the fact that it allows you to shift some of the data processing time required to a daily schedule, which lets you write simpler analysis code that will return results faster when the goal is to perform trip level analysis.
Adding meta information
As you get data across many devices/trips, it can become difficult to navigate. A single device can easily generate 1000+ trips per year - and thus it can be useful to 'tag' the trips with meta information. We consider two categories of meta information:

1: CAN/LIN based meta information
A lot of meta information can be extracted from the CAN bus data itself. Examples may include on-request data like the Vehicle Identification Number (VIN), ECU firmware versions, alerts, DTC values and similar. Such information can be extracted just like any other CAN/LIN signal through the aforementioned data aggregation methodology.
For example, if your trip contains an ECU FW version via a specific CAN signal, you can extract the 'first' observation of this in the trip period, which will let you easily filter trips by that parameter.
This can also be used creatively via custom signal aggregations, e.g. to determine if a trip involves battery charging, a certain threshold being crossed for X seconds, a certain alert being active for Y seconds, a specific geofence being triggered etc.
Note that such meta information may often be available only on-request, meaning you may need to configure the relevant transmit messages in the CANedge. Here we generally recommend to request the information, e.g. a VIN, every 1 second - rather than e.g. requesting it only as a 'single shot' message. By having e.g. a vehicle ID available every 1 second, it allows you to visualize this data in e.g. dashboards regardless of whether you query the full trip - or a small 10 second subset of a trip. In your queries, you can easily ensure that only distinct entries are returned. Further, having a meta ID every 1 second will have practically zero impact on your overall file size as you will most likely be recording 500-2000 frames/second overall.

2: External meta information
Some meta information may not be available from the CAN/LIN bus. This could e.g. be the name/ID of the driver or data on the weather. Such data can be linked with your existing data lake by e.g. adding it as CSV/Parquet files - or by linking to it as a separate data source entirely.
One way of linking such data to your existing data lake is by also storing the data in a consistent CSV or Parquet file structure. For manual data entry, you may e.g. have a process of registering the trip time, device ID and driver ID in a simple CSV file or a Parquet file. On a daily basis, you can upload a new file into a date partitioned structure on S3 in your data lake (e.g. in the aggregations folder next to your trip summary table). The device ID and trip start provide sufficient information for joining the two tables, even if the trip start timestamps are not perfectly matched. Via e.g. Athena based SQL queries it is trivial to create joins where the trip start values e.g. fall within +/- 10 minutes of each other.
For non-manual data like e.g. weather data, you may be able to leverage simple API extraction methods, enabling you to automatically create daily Parquet files with the relevant data. Alternatively, you can skip the creation of Parquet files entirely if your frontend tools enable you to handle such data as a separate data source and join it on-the-fly with your data lake.
A common data design for data lakes and lakehouses is the medallion architecture. The data work flow we have described so far can be linked to this design and the 3 layers:
- Bronze: Integration of raw MDF log files
- Silver: DBC decoded and filtered Parquet files
- Gold: Aggregated Parquet files focused on insights

Frontend: Data visualization
We now shift focus to the frontend, specifically how you may visualize your backend data.
Why visualize data from your devices?
Visualizing CAN/LIN data is integral to most use cases:
- Plotting is a core tool in most analyses/diagnostics
- Charts and graphs are key in reporting and data sharing
- Visualization tools can help navigate/browse data
- Useful in presenting complex analytical results
- Helps to sanity check analyses and modelling

When designing your data visualization setup, we recommend to consider below:
- What visualization tool to use? Ensure that your visualization tools are compatible with your processed data and enable you to deploy the required views of your data
- How interactive should visualizations be? Static visualizations are often problematic as you often need to create new custom views. However, excess interactivity may result in complexity and unintended data access
- How frequently should visualizations be updated? You can set up the CANedge to split data in 10 second intervals to achieve near real-time updates - but at a significant storage/processing cost vs. e.g. a 30 min frequency
- How to handle visualizations across devices/trips? Even if you have performed data aggregation across devices and trips, it can be complex to visualize such data in a meaningful way
- How to balance costs vs. performance? Determine how fast your visualizations need to be vs. the impact this will have on the cost of e.g. storing the underlying data
- How to manage users and security? Your visualization tool and data structure will typically need to enable different users with customizable access rights in order to make data sharing practical, secure and performant
Solution example: Grafana-Athena dashboards
Our recommended solution for large-scale data visualization is our Grafana-Athena dashboard integration. This uses Athena to visualize your AWS S3 Parquet data lake, with multiple benefits:
- Free: Grafana offers a free cloud tier, useful even at scale
- Easy-to-deploy: Linking your backend to Grafana takes <5 min
- Customizable: You can fully customize your dashboards
- No duplication: Re-use the existing backend infrastructure
- User control: Easily control user access rights
See the CANedge Intro for step-by-step deployment.

In Grafana, you can set up various types of dashboards (we provide templates for each):
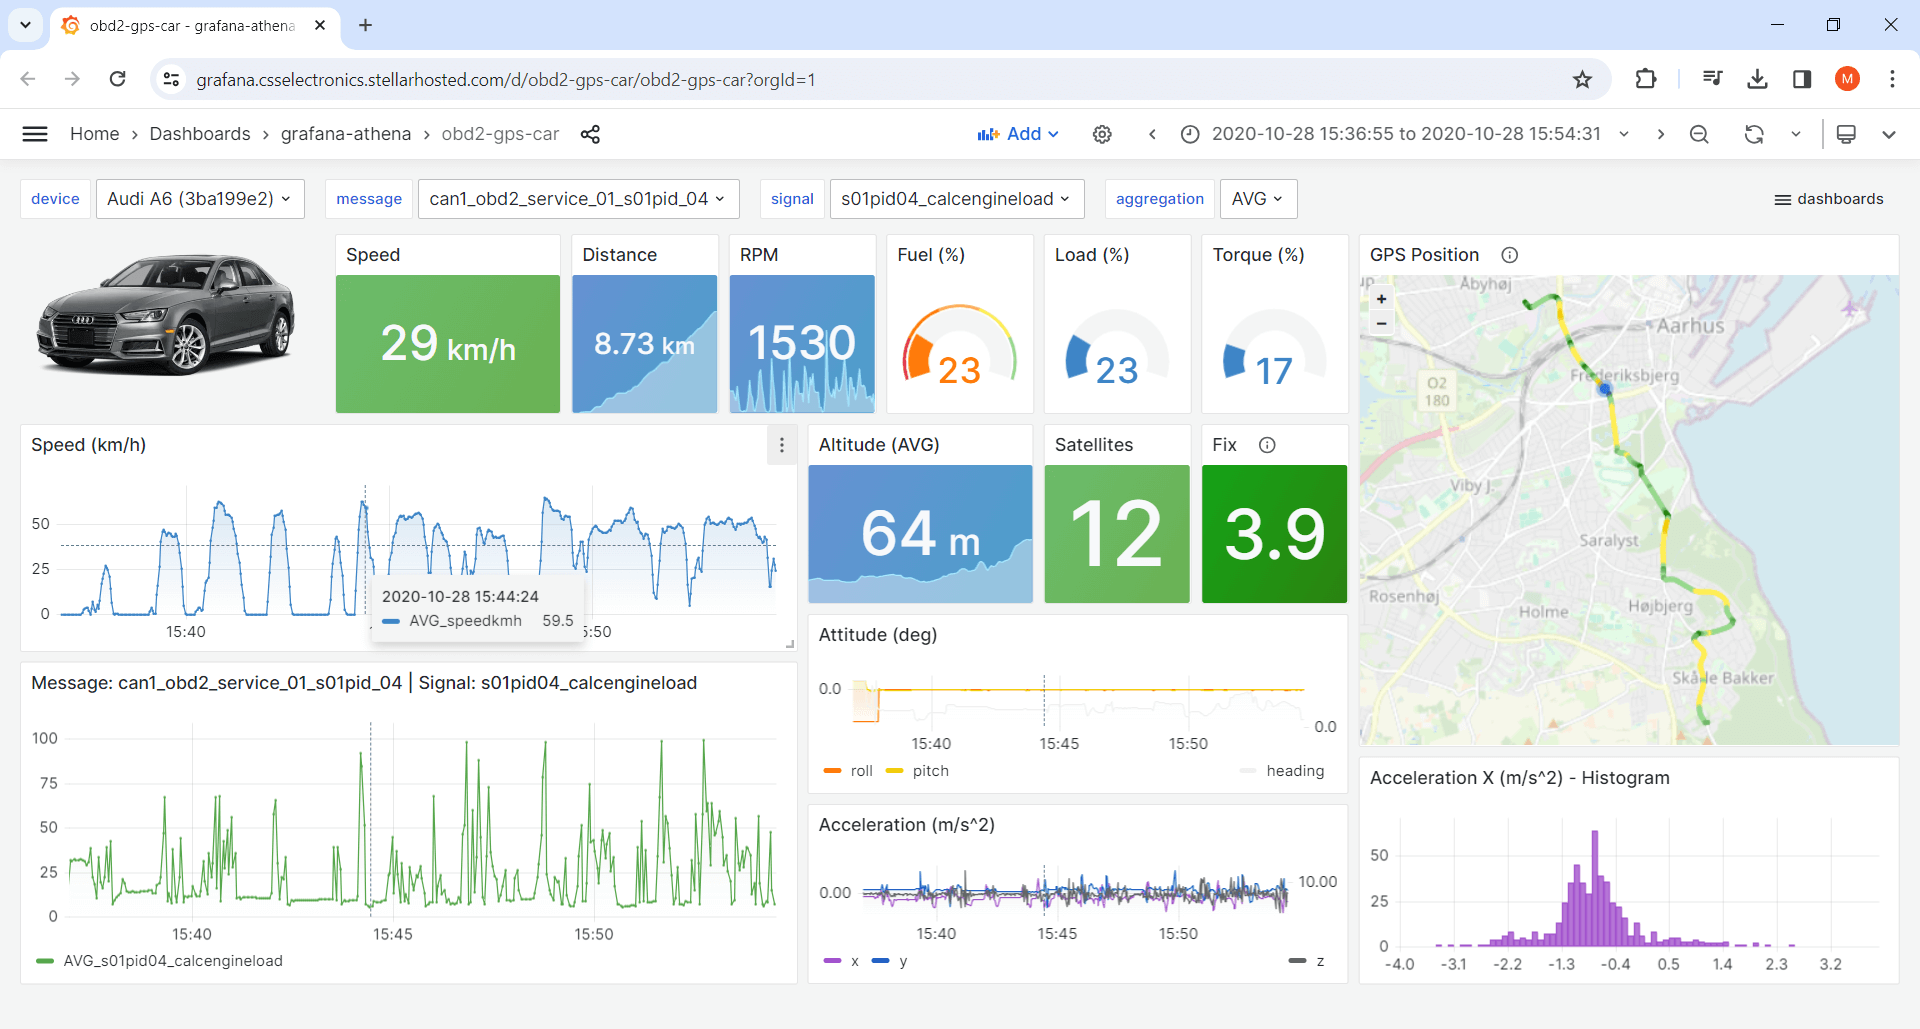
1: Device dashboards
Device dashboards let you visualize data from a single device at a time, with dropdown panels letting you switch between devices in your data lake and e.g. show specific signals. You can of course create multiple device dashboards, focused on different aspects of the data.
Tip: Navigate our 20+ playgrounds via the top-right dropdown.
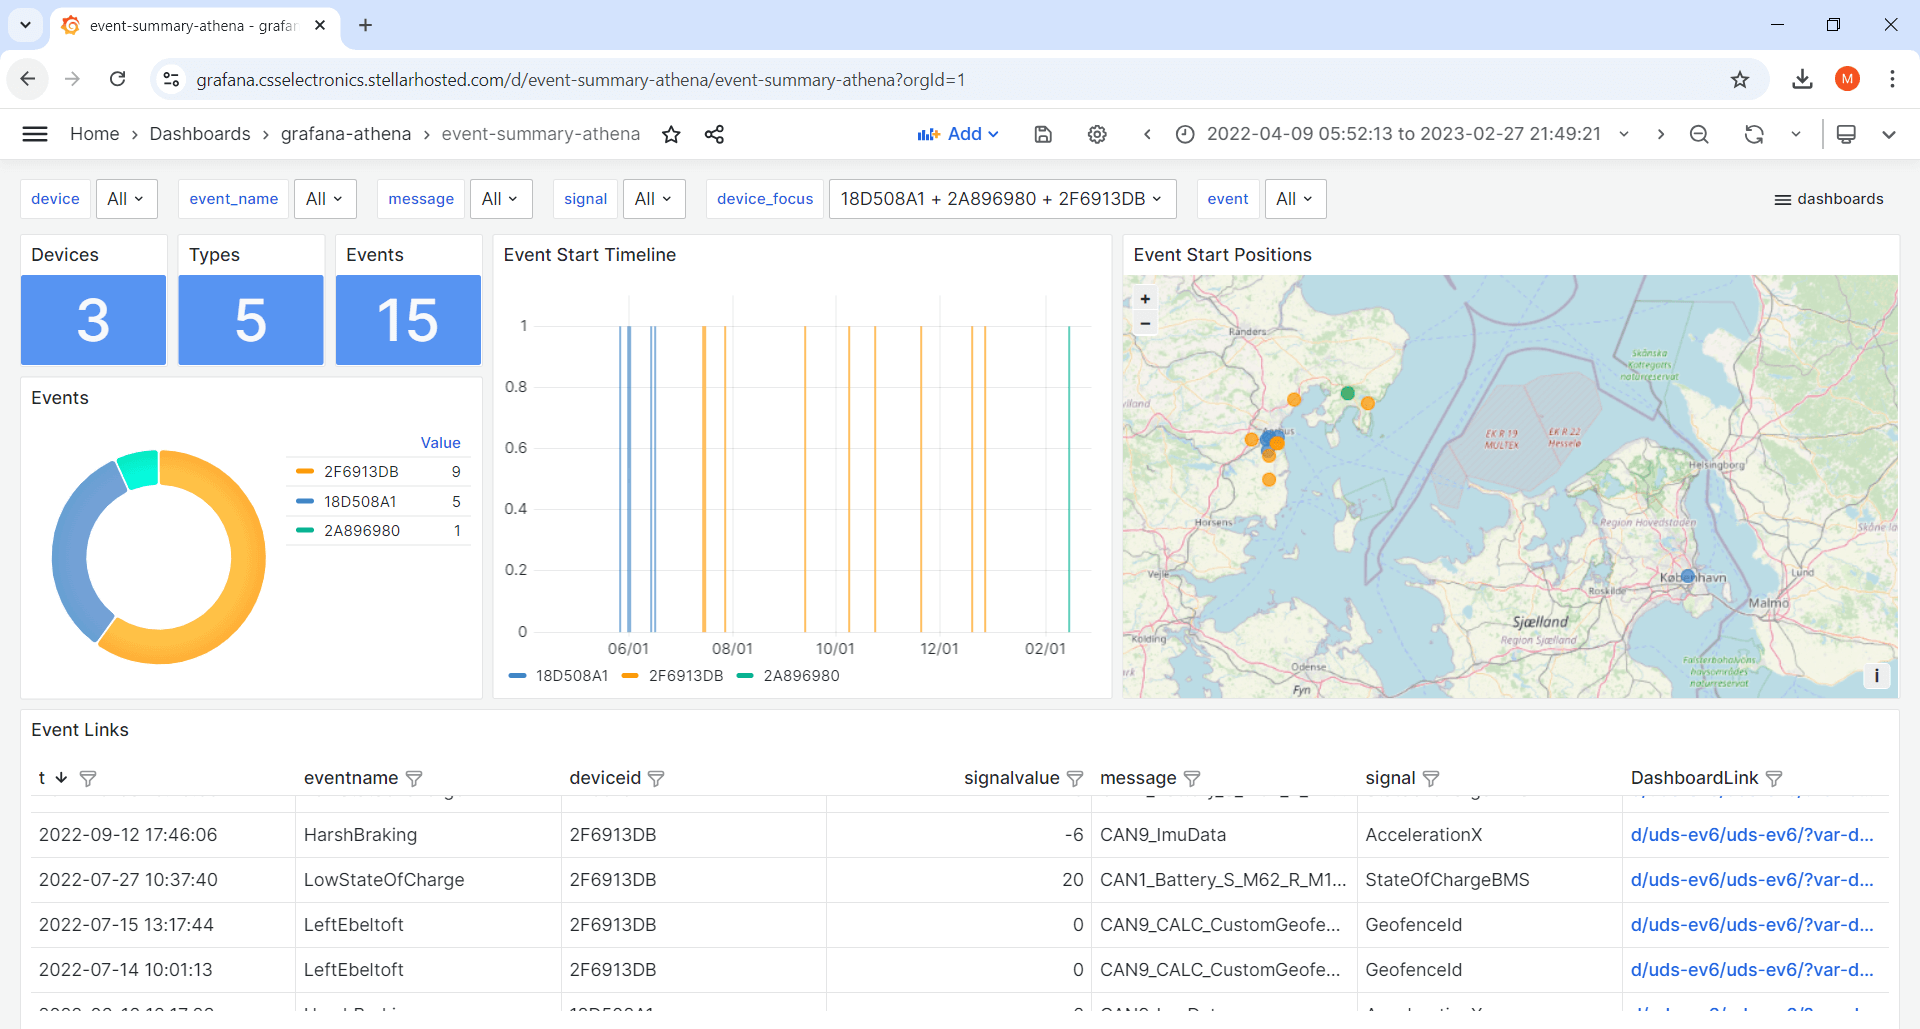
2: Event summary dashboards
Event summary dashboards let you visualize event meta data across devices and event types, e.g. speeding, activated DTCs or geofence events. To review a specific event of interest, you can use the built-in dashboard link to open the more detailed device dashboard and show e.g. +/- 30 min surrounding the event.
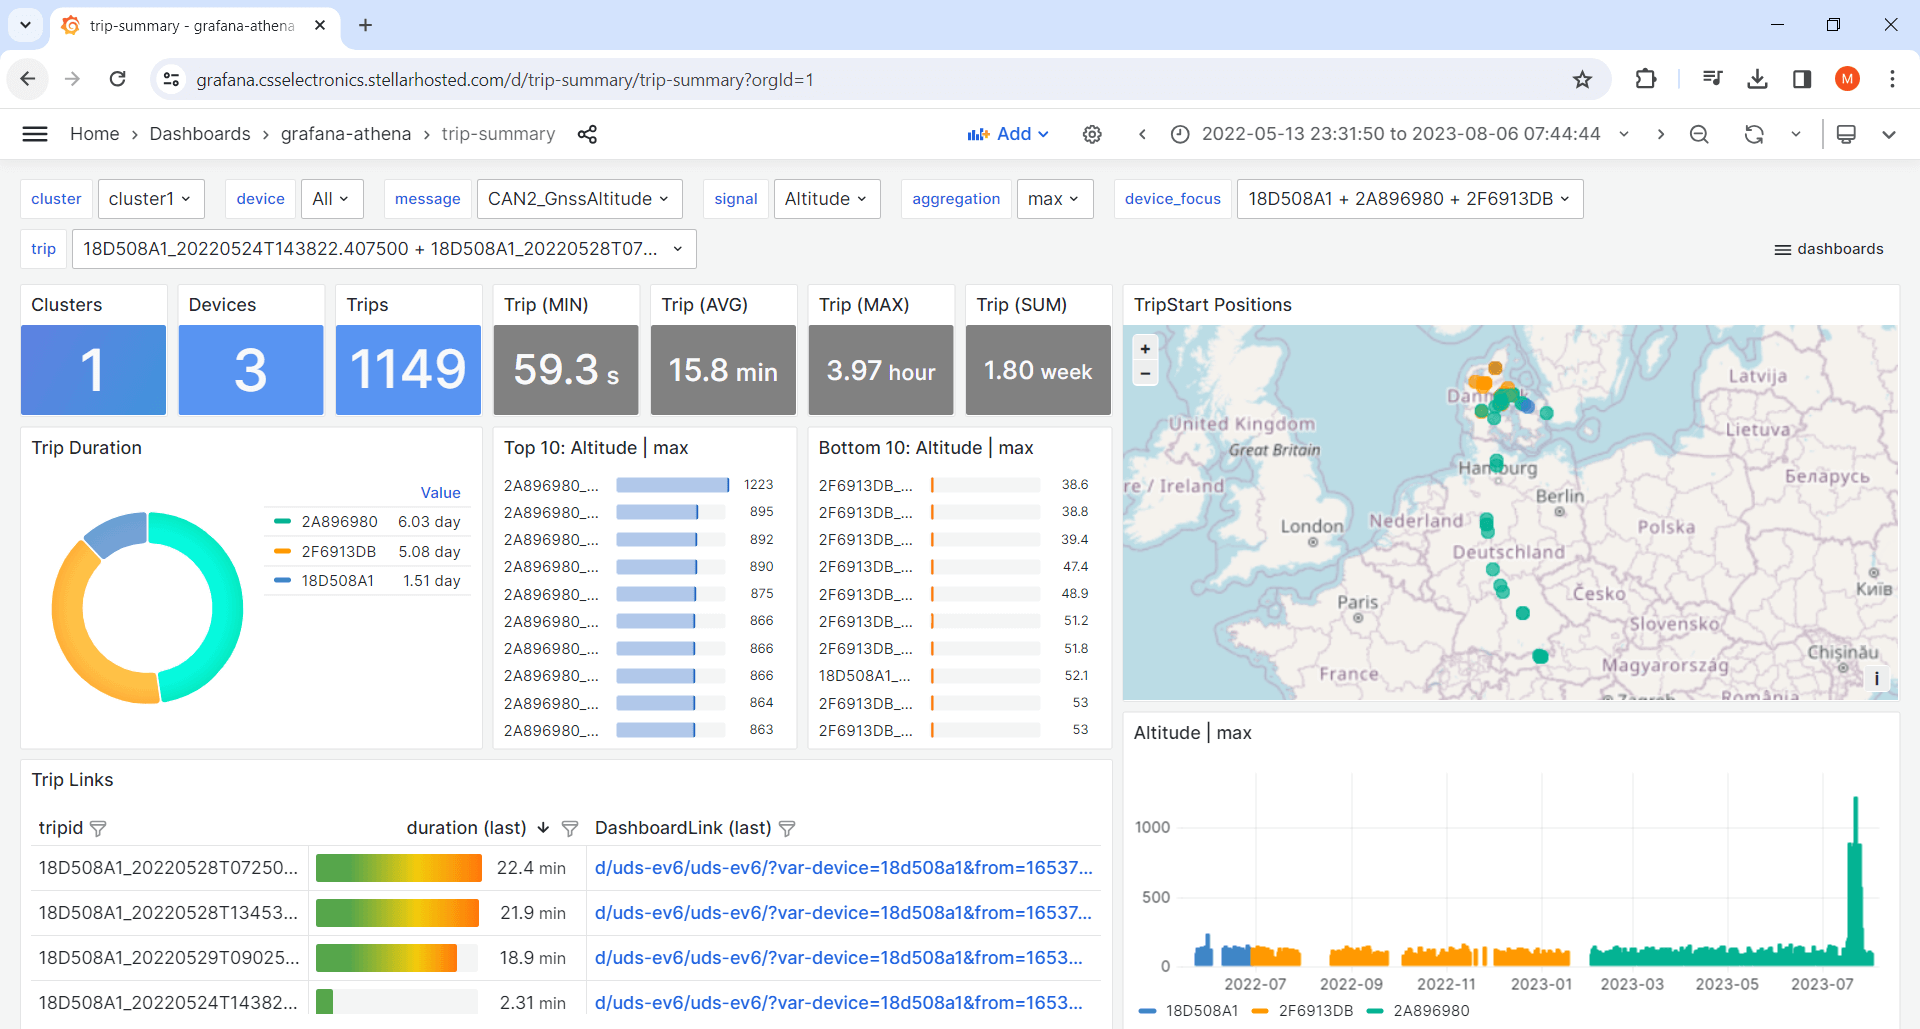
3: Trip summary dashboards
Trip summary dashboards let you visualize aggregated data, e.g. across devices and/or trips. This can be useful in e.g. browsing trips, filtering them by meta information - or to create cross-device comparison dashboards.
You can also create cross-dashboard navigation, for example adding a link next to trips in your summary dashboard to allow users to jump to the corresponding trip in the device dashboard. Learn more about Grafana-Athena in our article and the CANedge Intro.
Alternative visualization tools
Of course, numerous other alternative visualization tools exist, see also the overview in our MF4 decoder article.
Azure: If you are working in an Azure environment, you can still leverage the data lake structure and infrastructure as discussed previously. However, instead of Athena you may prefer to use e.g. Synapse/Fabric, which offers similar functionality. Grafana does not come with a data source plugin for Synapse/Fabric, but you can instead visualize the data in PowerBI, which offers an alternative way to create dashboard visualizations. We provide a step-by-step guide for setting up PowerBI-Synapse in the CANedge Intro.
Google Cloud: If you are uploading data from your CANedge devices to Google Cloud, you may opt for using Google BigQuery instead of Amazon Athena to query data from your Parquet data lake. Here, Grafana offers a BigQuery plugin that enables direct integration - see our intro to Grafana-BigQuery for details.
Self-hosted: In a self-hosted context, you can replace Athena with ClickHouse and then use Grafana's ClickHouse data source. We describe this setup in the CANedge Intro.
As a supplement or alternative to Grafana, you can also consider using Excel to visualize your data and/or create reports. In our Excel + CAN intro we outline how you can directly query data from your data lake in Excel using ODBC drivers. This is great if you e.g. wish to create classic Excel reports that dynamically show data from your data lake - without creating heavy worksheets.
Frontend: Advanced data analysis
In this section we focus on advanced data analysis via scripting.
Why perform advanced data analysis?
In many large scale use cases, the goal is to extract insights from the data that may not be easily available via the pre-processed data. Examples may include:
- Specialized ad hoc analyses (not suited for automation)
- Statistical analyses that take hours/days to complete
- Complex data labelling (e.g. to map events in the data)
- Advanced modelling, e.g. for machine learning or digital twins
Here we recommend using a programming language.

Below are relevant considerations in scripted analysis of large volumes of CAN data:
- What tools to use? The scripting tool(s) should both enable easy integration with your data - as well as offer the functionality you need for your analysis. Make sure to research e.g. relevant packages up-front
- How to deploy your scripts? Consider local vs. cloud, scaling of your compute resources and costs. Try to perform processing 'near' the data i.e. in the backend
- How to handle memory? You may easily exceed memory limits when e.g. analyzing TBs of data - consider how this affects your script design and setup
- How to consume results? Outputs and results need to be stored and accessible in a way that is suitable for your intended consumption, e.g. via reports or visualization
- What skills are required? Determine early on if your team has the skills required to perform the necessary analyses
Solution example: Python/MATLAB + Parquet data lake
For scripted analysis of big CAN data volumes, we recommend Python or MATLAB.
Both tools offer excellent support for Parquet data lakes, either stored locally or on S3. This way you re-use your existing data lake infrastructure. We provide Parquet data lake script examples for both Python and MATLAB in our CANedge Intro.
You can find articles on both programming languages below:


See also the CANedge Intro for script examples.

Below we comment on a few factors relevant to scalable analysis:

1: Deploy your script for scale
For GB/TB size data sets, you can perform test deployment locally. However, for production executions, it is recommended to deploy your script 'as close to the data' as possible. This improves speed by reducing latency - and can be vital in minimizing egress fees. It also allows you to more easily scale up/down the compute as required.
There are numerous ways to deploy MATLAB/Python in the cloud. For example (as we have already covered), you can deploy Python scripts in Lambda functions (for e.g. event-triggered brief executions) or Glue jobs (for e.g. schedule-based longer runs or ETL workflows). You can also go a step further and deploy EC2 virtual machines for more permanent deployments.
It is important to consider latency and egress fees when deploying your scripts if your data is stored in a cloud S3 bucket. As an example, you can consider our Python data aggregation script. This can be deployed locally to aggregate data from an S3 bucket. However, doing so will add significant costs and data transfer time from downloading the data. In comparison, deploying the same script in an AWS Glue job service eliminates the egress fees - and minimizes the latency. In our tests this can easily correspond to an 80%+ reduction in the processing time and costs.

Python lets you perform analysis on your AWS S3 Parquet data lake through Athena by using the AWS boto3 API. This enables two separate methods for running Python scripts at scale: You can deploy your Python script in AWS via e.g. Glue or EC2 instances and use e.g. pyarrow to directly interface with the Parquet data lake. Or, you can use boto3 and Athena to perform the data processing and return only the results for further processing in Python. Here, Athena performs the processing in the backend, meaning that you can deploy the Python script locally as well even if you are doing production scale statistical analysis, without transferring the raw Parquet data out of AWS.

2: Prepare for out-of-memory analyses
Both Python/MATLAB enable you to perform out-of-memory analyses across multiple files with ease. In MATLAB you can use tall arrays to load any volume of Parquet files and extract results in a few lines of code. For Python, you can achieve this by using an interface (Athena/DuckDB/ClickHouse/...). You then use the interface API to write SQL queries, let the processing run on the backend via the interface - and store the results in Python objects for further processing in your script. For more advanced work flows, you can also leverage the Python library Dask (e.g. deployed in an AWS EC2 instance) or PySpark (e.g. deployed via AWS Glue jobs) for beyond-memory analyses.

3: Design for end-consumption of results
For ad hoc purposes you can of course view the results of your analyses in the Python/MATLAB console. But you can also deploy e.g. web applications, Jupyter notebook reports etc. for consuming/sharing the results. Alternatively, both tools let you write your results to Parquet files. This can be leveraged to store e.g. statistical results in your existing data lake, making them presentable through the same visualization tools you may already use for your other data.
Alternative ways to perform advanced scripted analysis
Below are alternative examples of doing scripted analysis at scale:
MATLAB natively supports loading the CANedge MF4 files if you have the Vehicle Network Toolbox installed. This is useful for file-by-file analysis. However, you cannot e.g. load raw MF4 files into data stores or tall arrays, making this method less suited for large scale analysis.
MATLAB does offer 'data lake style' support for MF4 files if they are DBC decoded. This works similarly to the support for Parquet data lakes and even offers out-of-memory functionality like tall arrays.
However, we consider this less ideal than the Parquet data lakes for multiple reasons:
- The Vehicle Network Toolbox is not part of the base version of MATLAB
- Parquet data lakes are more interoperable than MF4 data lakes
- Preparing the DBC decoded data can be done via MATLAB, but there are limitations (e.g. no multi-frame support)
You can also use our Python API to directly load the CANedge MF4 files and analyse the raw data or DBC decode it. By doing so, you avoid the pre-processing step and you can directly process the raw files from your S3 input bucket.
However, in practice this also means that any scripts you develop will need to incorporate a significant element related to the initial pre-processing of the data (e.g. fetching files from S3 and DBC decoding them). This step then has to run prior to any subsequent analysis code.
In addition, the actual analysis code will be more convoluted as you will have to incorporate more complex file-by-file handling and memory considerations. You cannot rely on e.g. Athena SQL queries for handling out-of-memory result extraction.
A more subtle downside is that you often want to selectively analyse a small subset of messages from your CAN bus. With the Parquet data lake, you can do so efficiently because the data lake splits the DBC decoded data by CAN message, storing these in separate folders. In contrast, if you work directly with the raw MF4 files, you will need to fetch the entire file and iterate through all of it in order to extract the subset of messages relevant to your analysis. This is of course computationally expensive and time consuming.
The above downsides become particularly visible if you do repeat analyses across the same data. Here you end up performing the data pre-processing multiple times, which is costly both in terms of money and time.
Examples: CAN telematics at scale in practice
Below we provide real-life examples use cases that leverage the concepts outlined in this article:

Example 1: Research & development
Several OEMs use the CANedge to perform late stage prototype testing across large fleets. This requires historical data visualization, statistical analysis, cross-device benchmarking and more. Data does not need to be available in near real-time and processing can be optimized for costs. A typical OEM may need to collect 5 GB/device/month and store 2 years worth of data, i.e. 120 GB/device or 24 TB in total. Here, data pre-processing can be done via Lambda functions to create Parquet data lakes, combined with periodic data aggregation. The frontend typically combines visualization via Grafana-Athena with statistical analysis via Python or MATLAB.
Example 2: Predictive maintenance
You can deploy the CANedge2/CANedge3 across a fleet of vehicles to collect data to your own AWS S3 bucket, automatically DBC decode it and visualize it in telematics dashboards using Grafana-Athena. By extending this with event detection, you can easily set up alerts for critical events such as low tire pressure, DTCs, speeding, entering/exiting geofences and more. SNS based notifications can be sent immediately to subscribers via email/SMS. As an example, see also our 250+ AGV case study.


Example 3: Ad hoc remote diagnostics / compliance
Some use cases involve a very low level of data utilization. For example, an OEM may deploy the CANedge as a black box for ad hoc remote troubleshooting or simply legal compliance. Here, log files only need to be decoded ad hoc, making it excessive to set up Lambda functions. When relevant, data can be manually downloaded via CANcloud and processed via e.g. asammdf, Vector or PEAK tools. Optionally Python scripts can be used for browsing the data and identifying relevant subsets quickly.
Concluding remarks
In summary, the CANedge lets you perform CAN telematics across any number of vehicles/machines. And by deploying the right infrastructure, you can automate data collection, pre-processing and aggregation - enabling you to easily visualize/analyze your data.
We hope you found this article useful - you can of course contact us to get expert sparring on your use case!
Ready to deploy CAN telematics at scale?
Get your CANedge today!


