Telematics Dashboards - Visualize CAN Data [Grafana-Athena]

Need to visualize your CAN bus data in a dashboard?
The CANedge logs CAN/LIN data from e.g. vehicles or machinery. Data is stored on an SD and pushed to your server via WiFi/LTE.
In this intro we show how you can integrate your DBC decoded CAN/LIN data with Grafana - which lets you visualize your data through 100% customizable dashboards.
Tip: If you work in Google or Azure, see also our intros on Grafana-BigQuery or Grafana-Synapse dashboards.
Learn more below - and try our dashboard playground!


 CUSTOMIZABLE
Visualize your data in dynamic and customizable dashboards
 S3 DATA LAKE
Data stored in S3 'data lake' - with database-like speed (but 95%+ cheaper)
 YEARS TO MS
Navigate across years of data - and zoom in to the exact ms of interest
 SCALABLE
Easily scale from 1 to 1000+ CANedge devices - and from MBs to TBs of data
 FREE & OPEN
Grafana is 100% open source with a powerful cloud free tier

Open the dashboard playground - or deploy your own dashboard in < 15 min!
Grafana-Athena: How does the integration work?
Below we briefly explain a typical Grafana-Athena setup:
- A CANedge uploads raw CAN/LIN data to an AWS S3 bucket
- When a log file is uploaded it triggers a Lambda function
- The Lambda function DBC decodes the data to Parquet files
- The Parquet files are written to an AWS S3 'output bucket'
- Grafana visualizes this 'data lake' via an Amazon Athena plugin
This can be auto-deployed in <15 minutes - with zero coding.

Below we provide some additional detail on each core element of the integration.
Tip: You can also try our step-by-step guide with free MDF/DBC sample data now.
Deployment templates
The integration can be deployed quickly and easily via our AWS CloudFormation templates:
- The JSON templates describe all the resources to deploy in AWS
- Load a 'template' to deploy everything in a few clicks
- No AWS expertise is required (and our guides provide step-by-step guidance/videos)
- Changes can be easily 'rolled back'
Lambda function automation
Lambda functions serve to automate the processing of new data:
- The Lambda function runs every time a new log file is uploaded
- It loads relevant DBC files from your S3 bucket to decode the raw CAN/LIN data (using our MF4 decoders)
- The resulting Parquet files are written to an S3 output bucket
- Lambda functions are 100% serverless - you only pay when a log file is processed
- They are fully scalable, from 1 device to 1000+ devices
- All data processing is done automatically (and instantly) upon upload
S3 output bucket data lake
The S3 output bucket stores your decoded data as a 'Parquet data lake':
- The data lake consists of optimally structured Parquet files
- As a result, the data lake is both compact - and highly efficient
- The data lake is multi-purpose and can also be used in e.g. Python/MATLAB
- Data lake storage is 95%+ cheaper than using a database
Example: InfluxDB Cloud storage cost is ~1.44$/GB/month vs. the AWS S3 storage cost of ~0.023$/GB/month.
Athena interface
Grafana can visualize your Parquet data lake by using the Amazon Athena plugin:
- Athena provides a simple SQL interface to S3 Parquet data lakes
- Further, it can extract results from GBs of data in seconds via parallelization
- Athena is 100% serverless, meaning you only pay for the data scanned as a result of Grafana queries
- The cost of using Athena is extremely low at ~5$/TB (i.e. 1-10$/year for most use cases)
Grafana-Athena is today our recommended method for integrating your CANedge CAN/LIN data with Grafana.
To understand why, it can be useful to compare it vs. two previous integrations: Grafana-InfluxDB and Grafana-Backend:

About Grafana-InfluxDB [legacy]
Grafana-InfluxDB uses a similar work flow as Grafana-Athena: Uploaded log files are automatically DBC decoded via AWS Lambda functions to a more readily usable format. However, instead of writing the data to a Parquet data lake, the Grafana-InfluxDB integration writes the data to an InfluxDB cloud database, which can be queried by Grafana.

About Grafana-Backend [legacy]
Grafana-Backend involves deploying a Python application that listens to queries from Grafana. When a user refreshes the dashboard, the Python app fetches and processes the relevant MDF data from AWS S3. The Python script DBC decodes and resamples the data, then sends the result to Grafana for visualization.
Comparison details
Below we provide a comparison of the three integrations across key parameters (with details on each below):
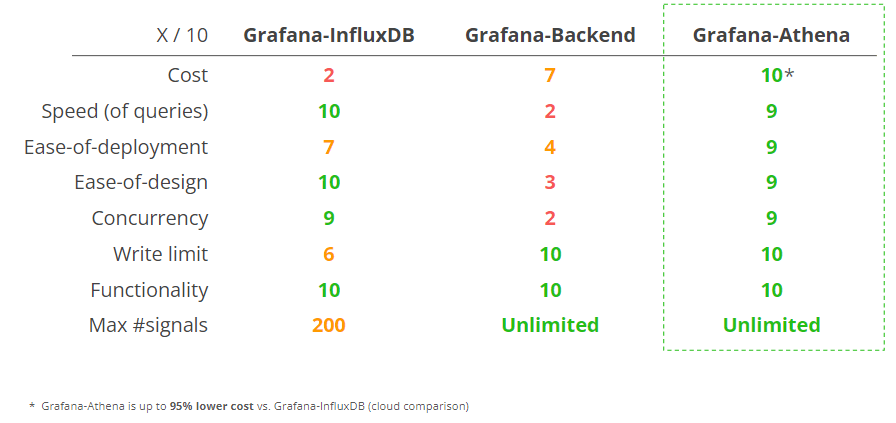
Costs: Grafana-Athena is 95%+ lower cost than Grafana-InfluxDB - and also far lower cost vs. Grafana-Backend for most use cases. For details, see our 'cost calculator' section below.
Speed (of queries): For almost all practical dashboard queries, Grafana-Athena and Grafana-InfluxDB offer very similar refresh speeds. In contrast, the Grafana-Backend is prohibitively slow at querying e.g. 50+ MB of data.
Ease-of-deployment: Grafana-Athena can be deployed via AWS CloudFormation templates, automating all resources. Further, no separate account is required beyond AWS and Grafana (in contrast to Grafana-InfluxDB).
Ease-of-design: Grafana-Athena and Grafana-InfluxDB offer almost equivalent and highly intuitive methods for designing dashboards. Grafana-Backend requires that every individual panel query is defined in a 'master panel', then referenced in separate panels - making Grafana-Backend dashboards far more convoluted to set up correctly.
Concurrency: The Grafana-Backend is not well suited for parallel users.
Write limit: Grafana-Athena writes data to S3, which means there is no practical write limit, while Grafana-Backend does not write data to any separate storage. However, Grafana-InfluxDB is limited at 60 MB/min, which can be a bottle neck already at 10+ CANedge devices. Hitting the write limits can cause Lambda functions to time out and result in manual handling.
Functionality: All integrations offer similar functionality in terms of the types of dashboards that can be created.
Max #signals: Grafana-InfluxDB has a limit of 200 signals/device, which can be a problem in some use cases.
The Grafana-Athena integration offers a unique performance/cost ratio and is 95% lower cost vs. comparable database-based integrations like Grafana-InfluxDB.
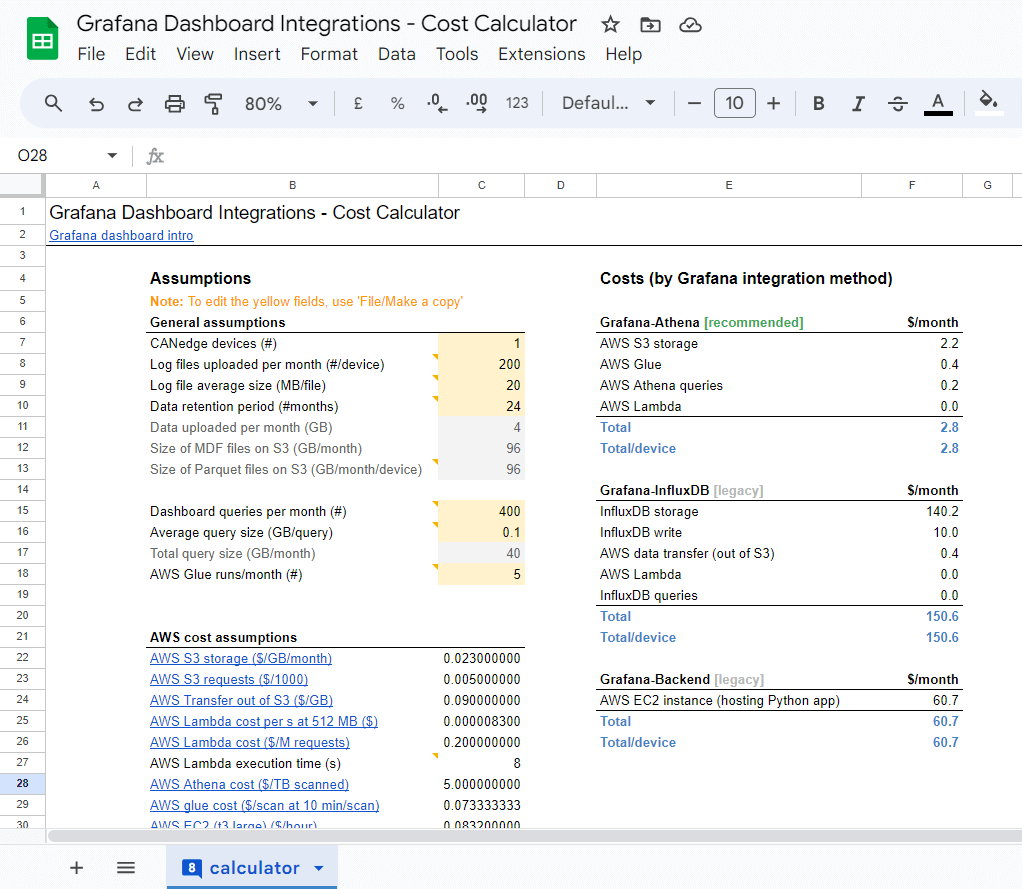
To illustrate this, we provide a basic cost calculator:
Grafana integration cost calculatorExamples
As evident from the calculator, most users obtain a 95%+ cost reduction by using Grafana-Athena vs. Grafana-InfluxDB.
In the default example, the Grafana-Athena cost for 1 device is ~3$/month vs. ~150$/month for Grafana-InfluxDB.
If your use case applies heavier filtering/prescaling, you might have e.g. a 90% smaller average file size of 2 MB/file. In this case the Grafana-Athena integration would cost ~0.8$/month vs. ~15$/month for Grafana-InfluxDB.
A larger deployment of e.g. 200 units with heavy filtering would cost ~24$/month via Grafana-Athena (~0.2$/device/month) vs. ~1500$/month via Grafana-InfluxDB (~15$/device/month).
The CANedge2/CANedge3 enables you to upload recorded log files to your own server (self-hosted or cloud) - including Amazon, Google and Azure cloud. Dashboard visualization and Parquet data lakes are core tools for enabling CAN telematics at scale - and we therefore provide step-by-step integration guides for the top 3 clouds.
Below we briefly outline the three integrations:
Grafana-Athena: Most of our users connect their CANedge2/CANedge3 to Amazon S3, which is our default recommended cloud. Here, the Grafana-Athena integration can be used. It offers the simplest deployment, widest set of functionality (e.g. automated trip summary aggregation) and most efficient use of e.g. date partitioning. Data is uploaded to S3, automatically DBC decoded by a Lambda function and output to a Parquet data lake stored in another S3 bucket. This data lake is then queried via the Amazon Athena SQL interface - e.g. by Grafana.
Grafana-BigQuery: Google Cloud offers a nearly identical experience to Amazon as it provides a native 'S3 interoperability' functionality. Further, the Grafana-BigQuery dashboard integration is nearly 1:1 identical to Grafana-Athena. Uploaded data is automatically DBC decoded via Azure Functions and output to a Parquet data lake stored in another bucket. This data lake is then queried via the BigQuery SQL interface - e.g. by Grafana.
Grafana-Synapse: Azure does not provide a native S3 interface, but you can deploy an 'S3 gateway' (Flexify) to enable the CANedge to upload data to your Azure Blob Storage container. Uploaded data is automatically DBC decoded via Azure Functions and output to a Parquet data lake stored in another container. This data lake is then queried via the Synapse SQL interface. The data can then be visualized in Grafana using the Microsoft SQL Server data source.
Easily set up your own dashboard in <15 min
Use our step-by-step guides and 'automated deployment templates' to set up your integration/dashboard in minutes - with zero coding or expertise required!
Create amazing CAN data visualizations
Display your data your way with beautiful graphs, synchronized GPS maps, gauges, tables, heatmaps, KPIs, histograms, pies, alert lists and more - practically anything is possible.
Fully customize your dashboard
Easily customize your dashboard panels and structure including dark/light theme, chart colors, styles, pictures and logos.
Make your dashboards interactive (and scalable)
Enable users to interactively select devices and parameters via dropdowns to e.g. compare data patterns across assets.
Add event detection, notification & visualization
Identify custom signal-based events (e.g. high temperatures, active DTCs, ...), trigger email/SMS alerts - and visualize with event summary dashboards.
Aggregate data to trip summary statistics and visualize
Visualize customizable trip summary statistics across your entire fleet to enable powerful comparative analyses and browsing - with convenient cross-dashboard links.
Use Grafana Assistant to explore/visualize data
Leverage Grafana Assistant to analyze/visualize your CAN bus data lake with AI - and prompt your way to production-ready custom dashboards!
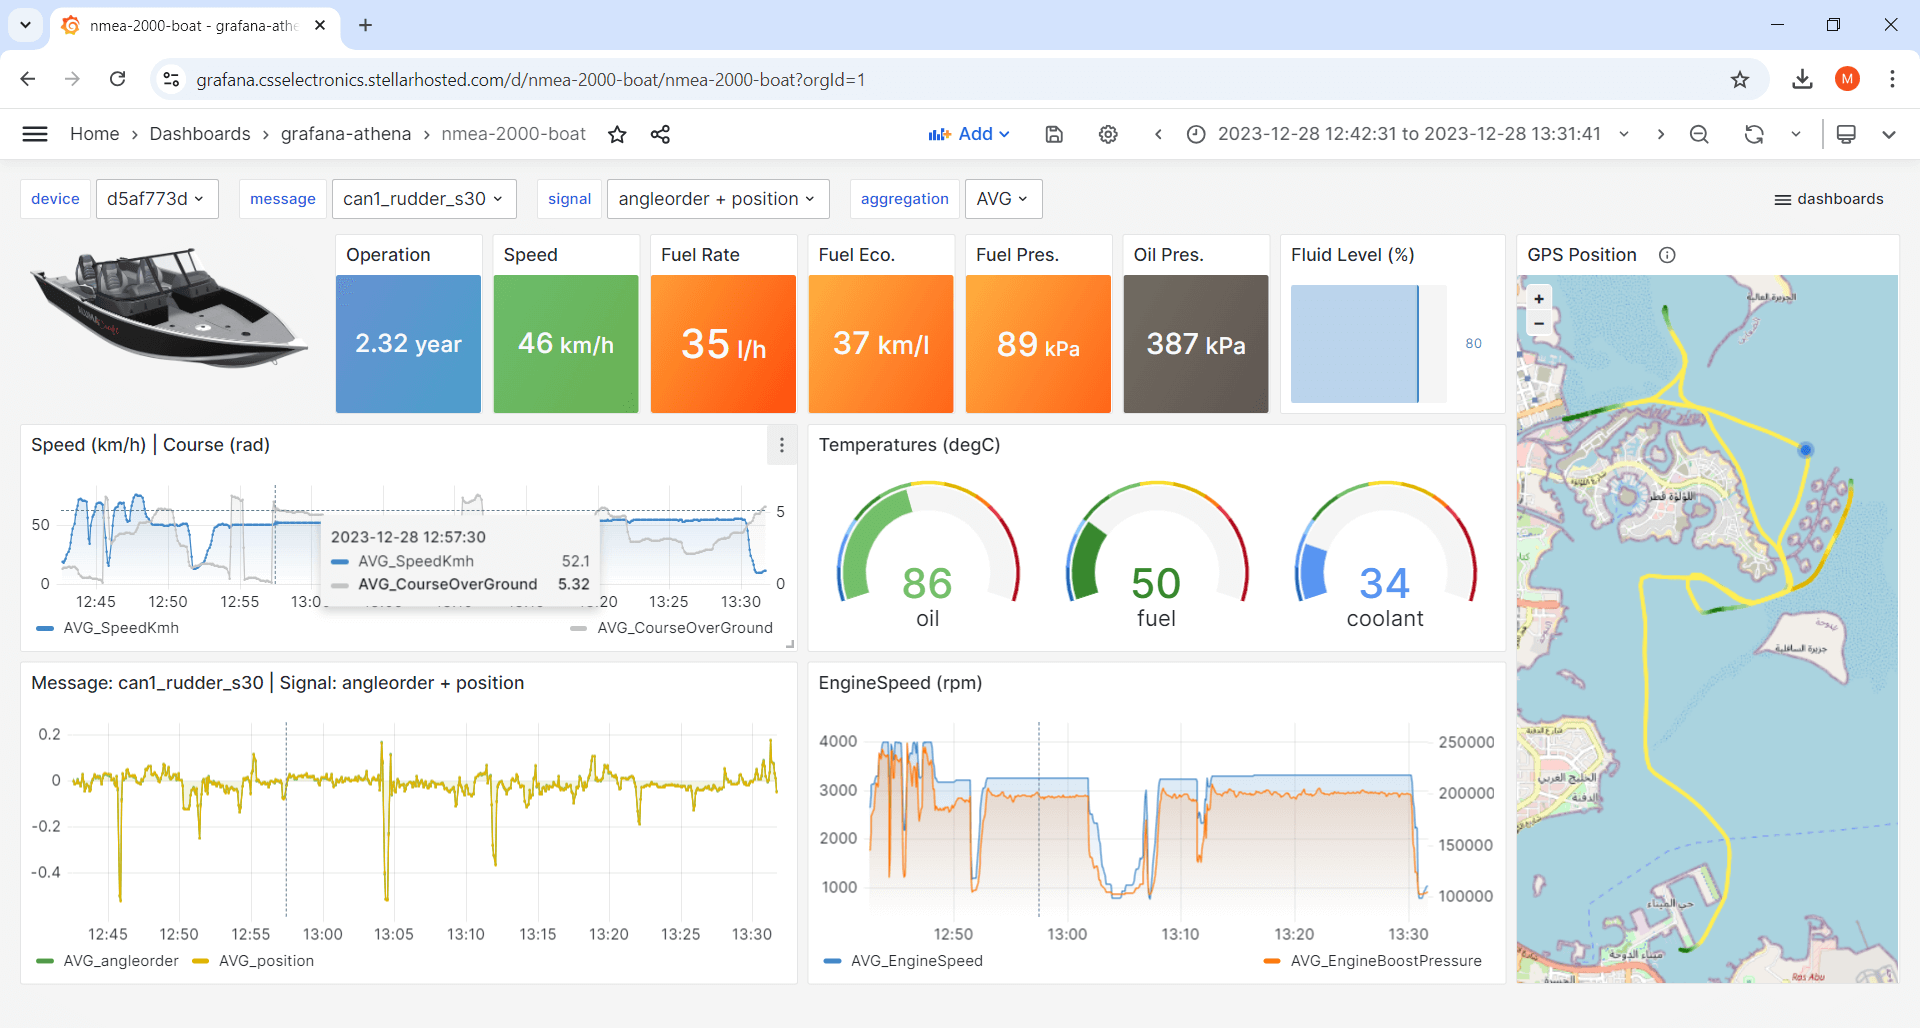
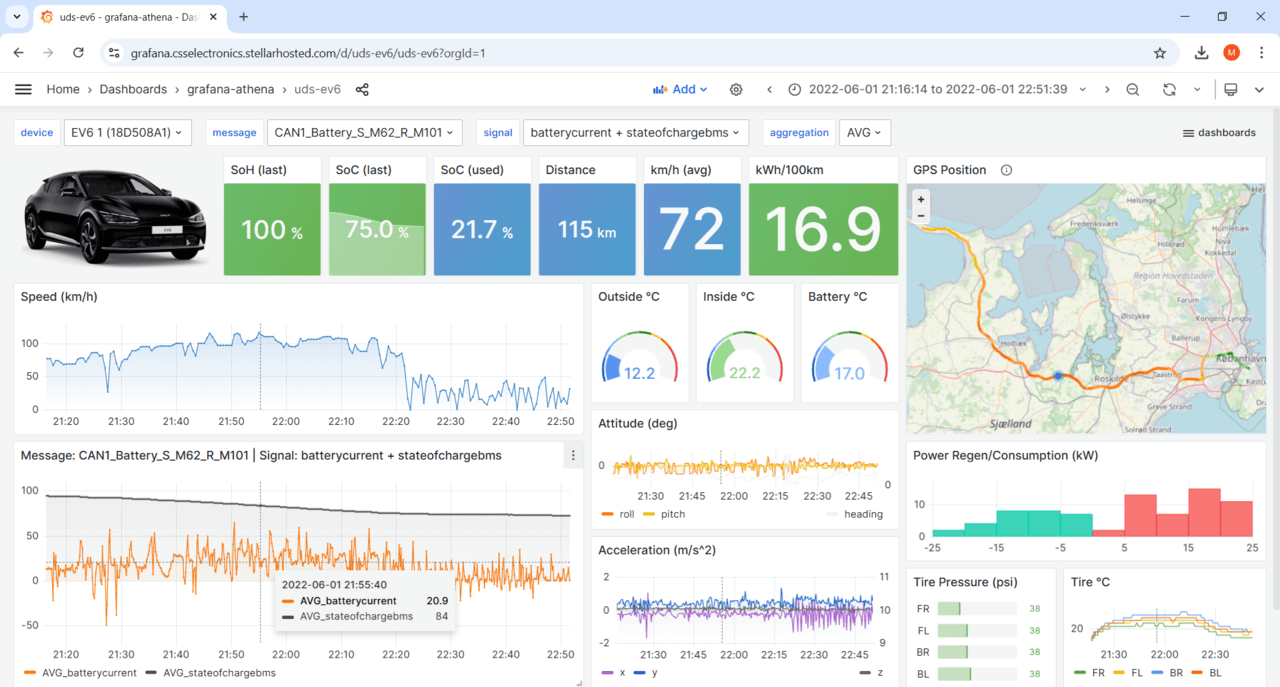
Examples of Grafana-Athena dashboards by protocol
Learn more about using the CANedge and Grafana-Athena across J1939, OBD2, NMEA 2000, ISOBUS, UDS, LIN and more:


Grafana dashboard types
With Grafana-Athena, you can set up various types of dashboards depending on your use case (we provide templates for each):
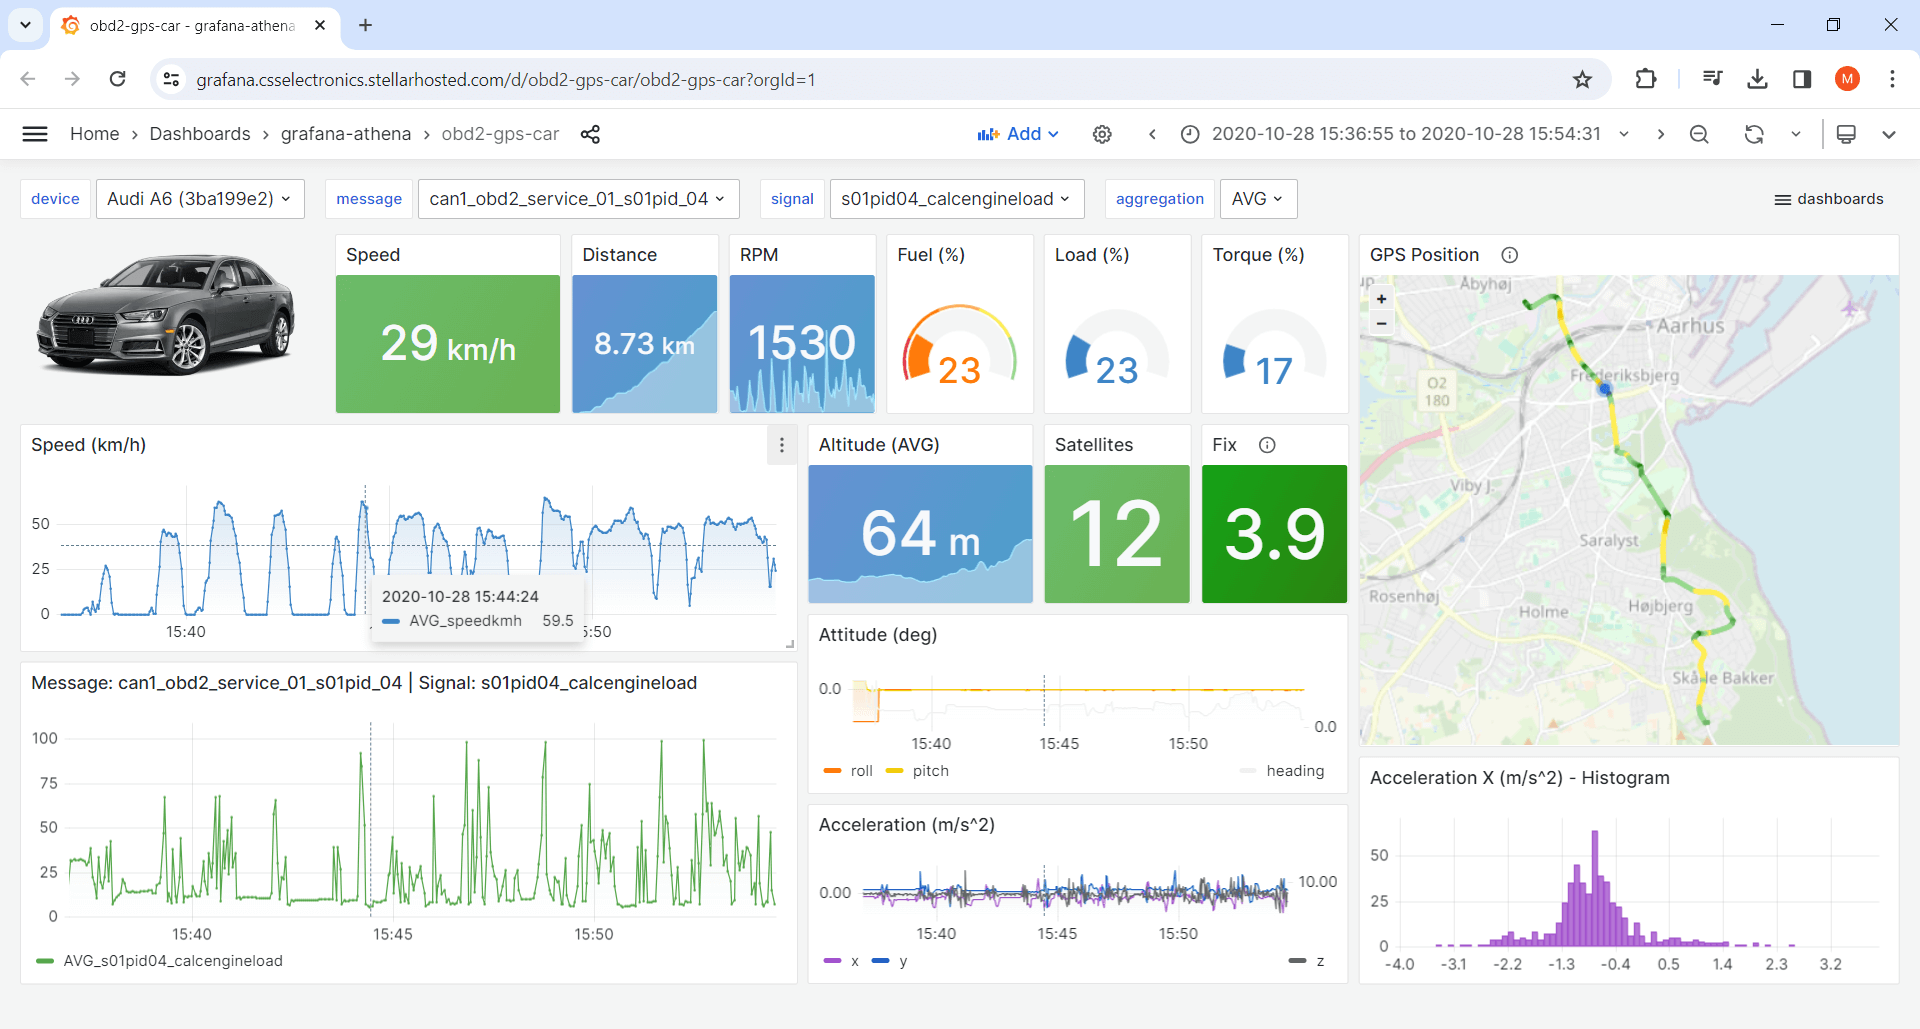
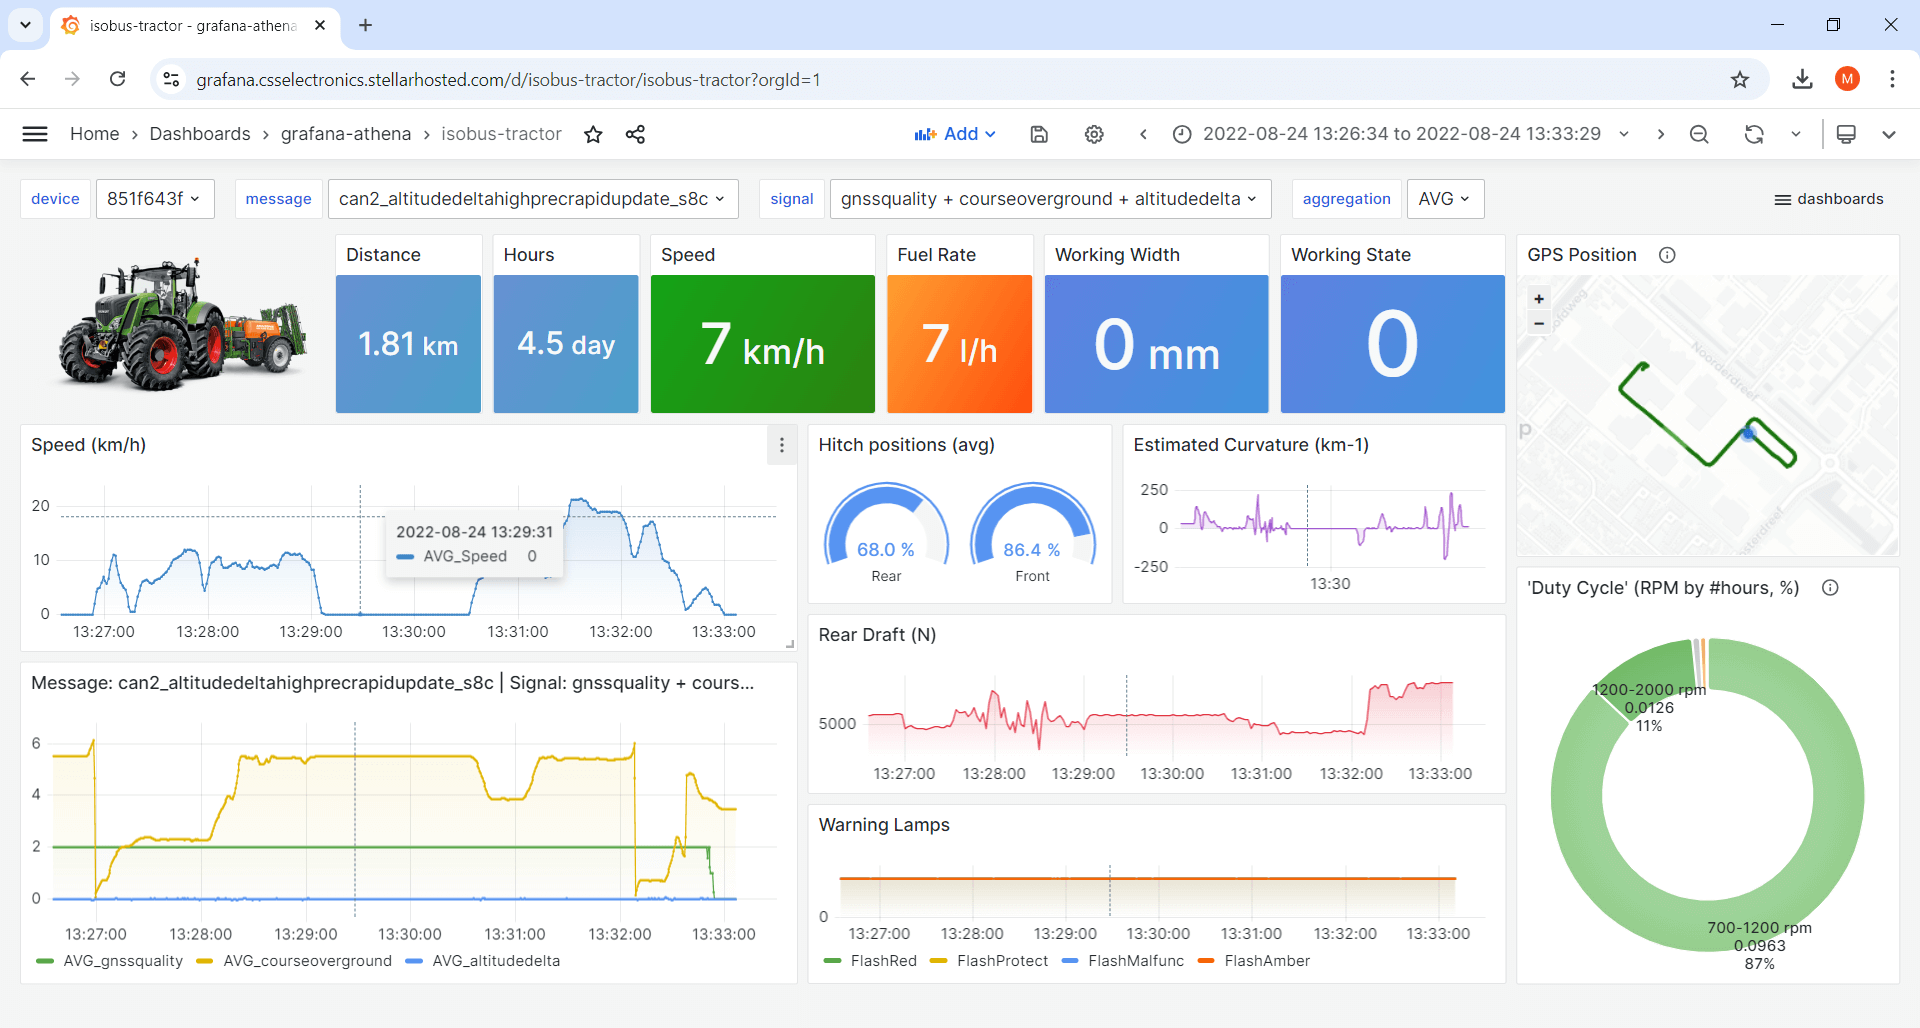
1: Device dashboards
Device dashboards let you visualize data from a single device at a time, with dropdown panels letting you switch between devices in your data lake and e.g. show specific signals. You can of course create multiple device dashboards, focused on different aspects of the data.
Tip: Navigate our 20+ playgrounds via the top-right dropdown.
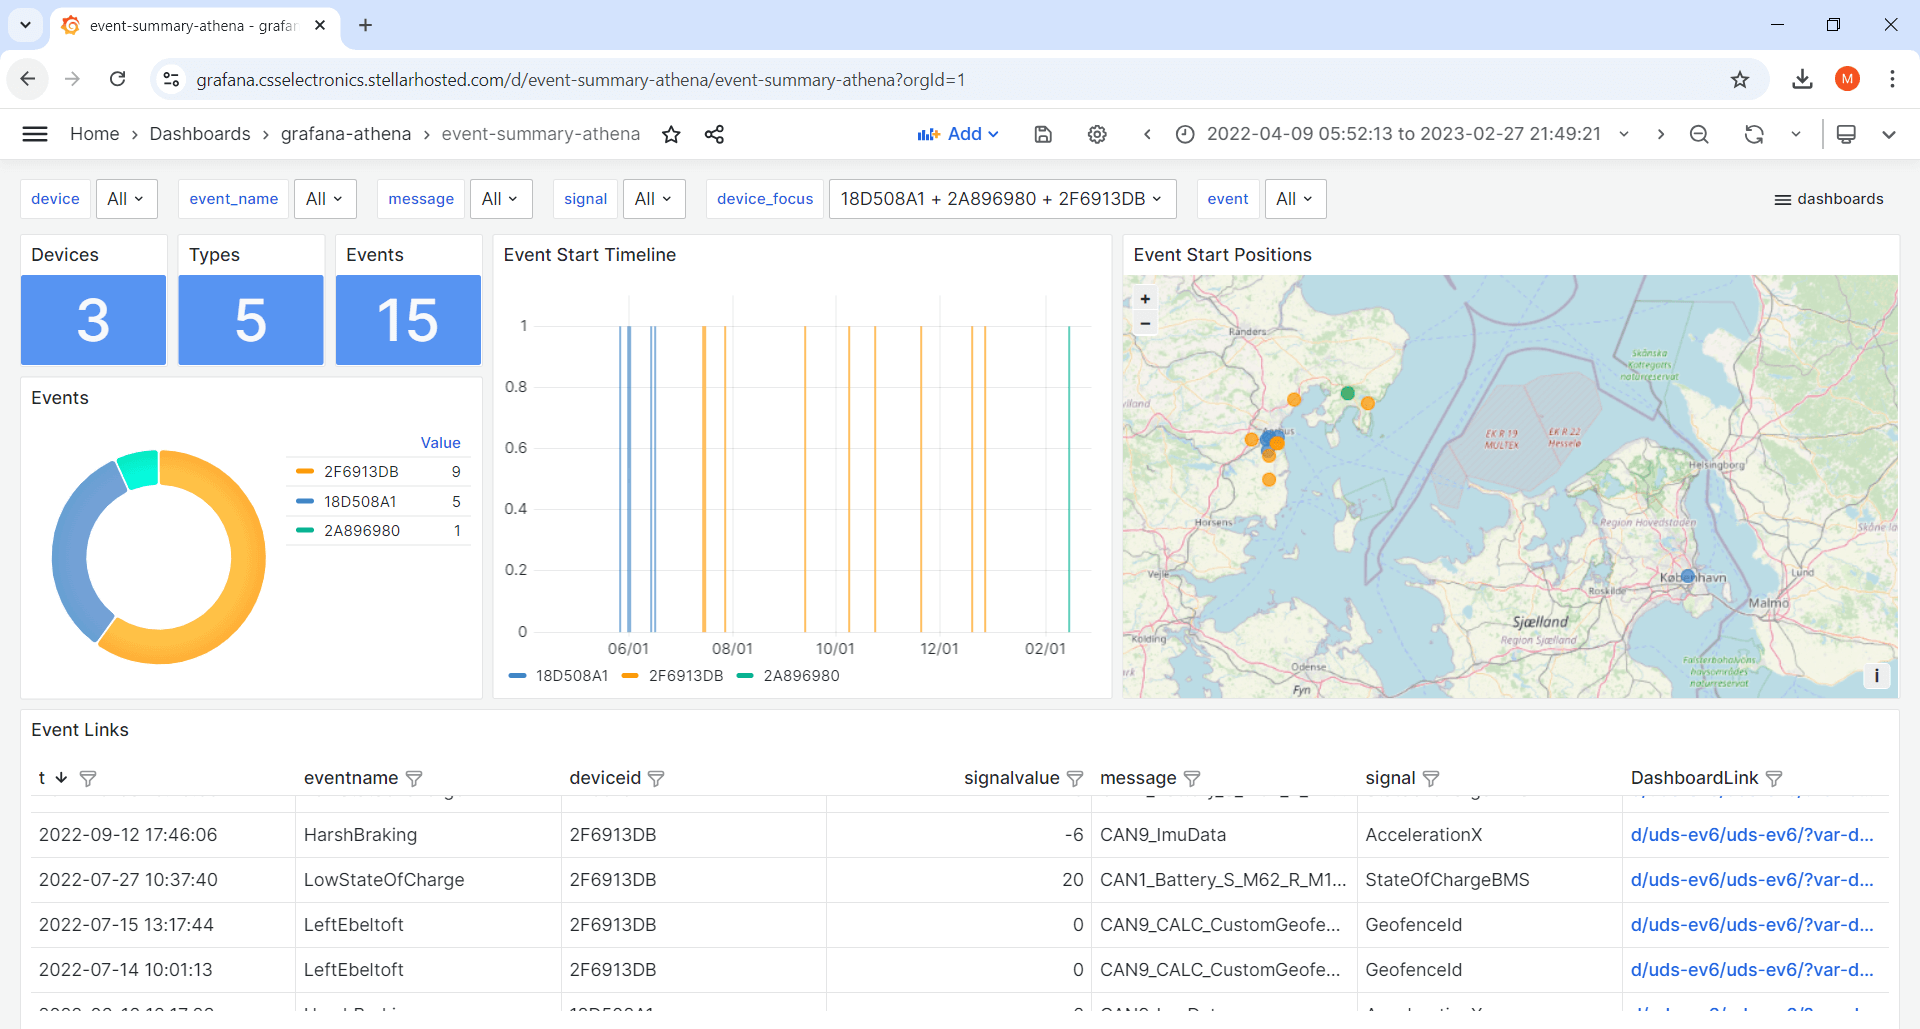
2: Event summary dashboards
Event summary dashboards let you visualize event meta data across devices and event types, e.g. high temperatures, battery faults, speeding, activated DTCs or geofence events. To review a specific event of interest, you can use the 'dashboard link' to open the more detailed device dashboard and show e.g. +/- 30 min surrounding the event.
Tip: Learn more in our CAN bus event detection intro.
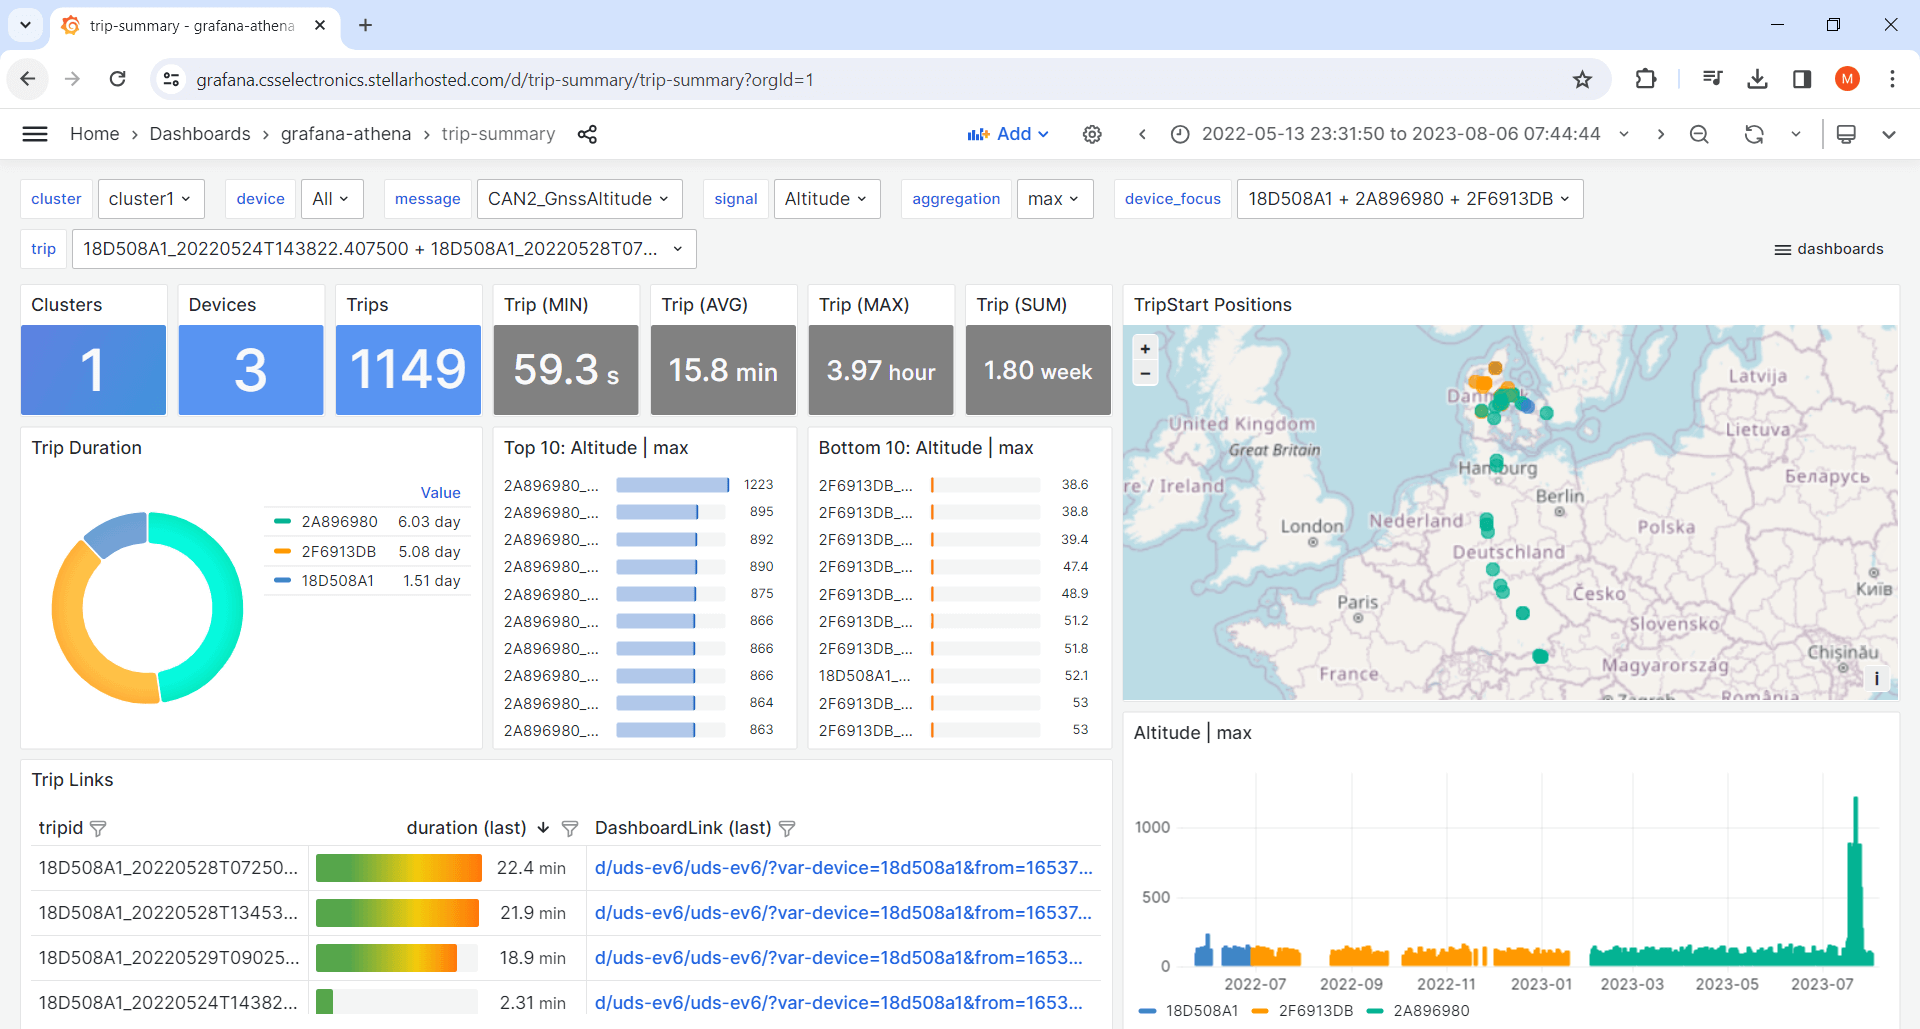
3: Trip summary dashboards
Trip summary dashboards let you visualize aggregated data, e.g. across devices and/or trips. This can be useful in e.g. browsing trips, filtering them by meta information - or to create cross-device comparison dashboards.
Tip: Learn more in our intro to CAN bus telematics at scale.
Monitor data across OEM prototype fleet
Need to visualize data from a fleet of vehicles during late-stage testing?
You can easily deploy the CANedge2 or CANedge3 in a fleet of e.g. 50 prototype vehicles to collect CAN data to your own AWS S3 server via WiFi or 3G/4G. Uploaded log files are automatically DBC decoded via Lambda functions and written to your AWS S3 based Parquet data lake. Your engineers can then visualize the decoded data via your custom Grafana dashboards


Visualize CAN/LIN data from your CANedge1
Want to visualize data that was recorded offline by CANedge1 devices?
The Grafana-Athena integration can easily be used even if you're logging data offline to an SD card via CANedge1 devices. Simply drag & drop your entire backlog of data (potentially GBs or TBs) onto our MF4 decoders to DBC decode it into a Parquet data lake on your local disk. By following the Grafana-Athena setup guide, you'll be able to set up an AWS S3 bucket for storing this data lake in a few clicks - and make it accessible for visualization in Grafana.
Build analytics platform towards your users
Need to create an white label dashboard solution for your customers?
The CANedge is designed for white labeling by OEMs and integrators. You can add your own physical logos on the products - and use our tools to deploy your own customized solutions for specific target audiences - e.g. for predictive maintenance, marine telematics, heavy-duty fleet management or OBD2 car telematics. As part of this, our Grafana-Athena integration makes it extremely easy and low cost to deploy use case specific or even client-personalized dashboards.


Setup local warehouse predictive maintenance
Want to set up a local self-hosted fleet management dashboard?
If you need to set up a basic predictive maintenance system to e.g. monitor state of charge (SoC) across a warehouse fleet of forklifts or AGVs, you can set up a MinIO S3 server on your local network and connect your CANedge2 devices via local WiFi routers. You can then visualize your data locally by self-hosting Grafana and integrating your data via the Grafana-ClickHouse integration.
FAQ
Grafana is a 100% free and open source dashboard visualization tool. You can self-host Grafana, though for most use cases we recommend the free cloud tier as it will fully suffice for 95%+ of users.
As such, the only cost is in making your CAN/LIN data available for use by Grafana. With the Grafana-Athena integration, you minimize this cost by storing your data in an 'S3 data lake', which is 95%+ lower cost than storing the equivalent volume of data in a database. For most use cases, the resulting AWS costs will be about 1-3$/device/month to enable the integration. For details see our cost calculator.
To deploy Grafana-Athena, you will need an AWS account. The Grafana-Athena integration is therefore perfect if you use the CANedge2/CANedge3 and have this connected to an AWS S3 bucket already.
Howevever, it is important to note that you can easily collect your data outside of AWS (e.g. offline to the SD card or to another S3 bucket in e.g. MinIO, Google Cloud, Azure, ...).
In such cases, you set up an AWS account purely for storing your Parquet data lake and running Athena. In this setup, you'd typically only use the S3 'output bucket' and Athena, while skipping the use of the S3 'input bucket' and Lambda functions.
Example 1: You have a CANedge1 logging data to an SD card and you wish to visualize it in Grafana. In this case, you set up an AWS account and deploy the required resources. Next you, extract your log files from the device SD card and run them through our MF4 decoders locally. This outputs your Parquet data lake as local Parquet files. You can then easily upload these to your AWS S3 output bucket (as per our guides). Your uploaded data is now ready for visualization in Grafana.
Example 2: You have a CANedge3 uploading data to Azure blob storage and wish to automate the data processing. Here you can use Azure Functions to automatically write the DBC decoded Parquet files to your AWS S3 output bucket. This enables a similar automation as AWS Lambda functions, but with this first part of the workflow running in Azure. Note, however, that we do not provide ready-to-use automation code outside of the AWS environment.
If you prefer, you can alternatively use the 100% open source Grafana-ClickHouse integration. This is very similar to Grafana-Athena, but can be self-hosted and e.g. run locally (more below).
Alternatively, you can of course use one of our legacy dashboard integrations, Grafana-InfluxDB or Grafana-Backend. Both of these can be self-hosted or run e.g. in other cloud environments. However, given their legacy status we do not offer technical support on these integration methods.
For most use cases we recommend the Grafana-Athena integration as it offers a very good mix of features: It is easy to deploy and automate, it scales to any number of units - and it offers extremely high processing speed at very low cost.
However, some users may prefer a 100% self-hosted open source alternative. Here we recommend the Grafana-ClickHouse integration, which is very similar to Grafana-Athena. You simply deploy ClickHouse on your host machine, point it to your Parquet data lake - and link it to Grafana via the Grafana ClickHouse plugin.
With the Grafana-ClickHouse integration, you get a similar SQL query interface as Grafana-Athena, letting you re-use most examples across the two integrations.
Note that we do not offer technical support on the Grafana-ClickHouse integration, as it is mainly intended as an option for more advanced users.
Yes, you can process the data from your CANedge1 locally via our MF4 decoders to create a local Parquet data lake. By following our Grafana-Athena guide, you can then set up the required resources in AWS. Once done, you can upload your Parquet files to the S3 output bucket and start visualizing the data in Grafana.
The Grafana-Athena integration requires the use of AWS S3 and AWS Athena, hence it cannot run locally or in a self-hosted setup.
There are, however, several other dashboard visualization tools that directly integrate with Parquet data lakes - meaning you can create very similar integrations by deploying your data lake locally or e.g. on a self-hosted MinIO S3 bucket. Such integrations are outside the scope of our technical support, however.
Alternatively, you can use our Grafana-InfluxDB or Grafana-Backend integrations for local/self-hosted visualization. These are now legacy and hence not in scope of our technical support - but you can find the installation guidance on our github page.
Yes. The CANedge is designed for 100% interoperability - and you can integrate the data into practically any database and visualization tool.
Below we outline different ways on how you can build on the existing integrations:
Parquet data lake
With our CANedge MF4 decoders, you can easily create a standardized Parquet data lake with DBC decoded data. In the Grafana-Athena integration, we leverage this to create a simple integration with Grafana, as AWS Athena natively supports Parquet data lakes stored on AWS S3. However, many other tools exist that also let you work with Parquet data lakes and visualize them - enabling you to quickly integrate your data with your preferred tool.
Python API & database integrations
In our CANedge-InfluxDB integration we use our Python API to write data to a database. The example takes outset in InfluxDB, but you can quickly modify the scripts to instead push data into e.g. MySQL, Graphite, Microsoft SQL Server, OpenTSDB etc. Once you have pushed your 'physical values' data into your preferred database, you can use any visualization tool that integrates with the database. For example, Grafana can load data from any of the databases mentioned above (and many more). You could also e.g. use Tableu, Microsoft Power BI, Kibana, Splunk and many others.
With the Grafana-Athena integration, you work with your CAN signals in their original timestamp resolution. This lets you go from viewing months of aggregated data - to zooming in on a small period that involves millisecond level resolution.
In some cases you may identify an event via the dashboard that you want to deep-dive on via other tools - e.g. Vector CANalyzer, the asammdf GUI etc. Here, you can identify the start/stop period of the event and then fetch the raw log files from S3, e.g. using CANcloud.
The CANedge lets you configure the log file split size/time. If you e.g. set this to 10 seconds, a new log file is created every 10 seconds - and if the device is connected to your AWS S3 bucket, it will immediately upload the file.
With the Grafana-Athena integration, the uploaded log file is then DBC decoded via the Lambda function - and the result is written to your Parquet data lake. This makes it available for queries via Grafana within a few seconds after the upload.
However, we recommend to split log files every 5-60 minutes. This minimizes file overhead and reduces your overall data transfer and storage costs. It also makes the log files more efficient and practical to work with in other software/API tools.
If you're new to terms like Grafana and AWS, this solution may seem technical. However, we encourage you to try the get started guide. It is designed for non-technical readers and we detail every step. Using our sample data, most users are able to set up a dashboard in <15 minutes.
Yes, we offer step-by-step docs on setting everything up - and if you have questions, we offer free technical support (within reason).
The vehicle telematics dashboard solution is designed with OEM engineers in mind. Here, there is often a requirement of performing more advanced CAN bus data processing - for example decoding of multi-frame response data (e.g. for J1939, NMEA 2000 and UDS).
Our MF4 decoders natively support multi-frame decoding across J1939, NMEA 2000 Fast Packets and ISO 11765-2 (e.g. for UDS/OBD), meaning that your data lake can be constructed to include signals that require multi-frame DBC decoding.
Ready to visualize your CAN data in browser dashboards?
Get your CANedge today!


