
Kia EV6 Telematics Dashboard [CAN Bus & UDS + DBC + Grafana]
Case Studies / CSS Electronics
CSS Electronics
CSS Electronics is a developer of CAN bus hardware incl. CAN/LIN data loggers and sensor-to-CAN modules [Note: This is an 'in-house' case study].
What problem did you solve?
I recently got my new Kia EV6 electric car. And of course, the first thing I needed to check was what data I could extract!
Specifically, I wanted to verify if I'd be able to extract more useful EV data from the Kia EV6 than my previous Nissan Leaf case study - in particular focused around driving efficiency.
Assuming this would be possible, I also wanted to create a visualization dashboard and collect data over an extended period for the purpose of creating a public 'data pack'.
Tip: Download the config, DBC and 10K+ km data!
Tip: See our ChatGPT + CAN intro using the EV6 data!
See also articles for the Tesla, Enyaq and Nissan Leaf.

How did you solve it?
From previous projects involving a Hyundai Kona EV, I had some experience successfully requesting UDS (Unified Diagnostic Services) data with the CANedge2. Since the Hyundai/Kia EVs share the same platform, I assumed there might be some overlap in their UDS request/response patterns.
Luckily, this turned out to be true and I was able to re-use the Hyundai Kona configuration and DBC file for my Kia EV6.
One cool implication is that the config/DBC used in this project should work across all the Kia/Hyundai EVs - incl. the Hyundai Kona, Hyundai Ioniq5 etc., Kia e-Soul etc.
Specifically, I leveraged information from an open source github project to create a CANedge2 Configuration File with a list of 'transmit messages' that would trigger certain responses from the Kia EV6. This involved using UDS multiframe requests with every request frame followed by a flow control frame. For details, see our intro to UDS and the actual Configuration File in the data pack (see below).
I configured the CANedge2 to connect to my iPhone as an access point via WiFi - and upload data to my AWS S3 bucket. This way, whenever I would enable my shared WiFi on my phone in the car, data would get uploaded by the device to the server.
Note: Since this case study, we also released the CANedge3, which simplifies this work flow by enabling direct upload to S3 via 3G/4G.
To install the device, I initially just connected it to the OBD2 connector (beneath a panel near the steering wheel) using our OBD2 adapter cable. This works perfectly well, but has the downside that the device remains powered (and transmitting) when the EV is turned off. The EV6 does not provide any 'default broadcast data' via the OBD2 connector, meaning a control signal cannot be used to start/stop the transmission of data into the car - meaning that ECUs could be woken up and the battery would be drained within a few days. To solve this, I modified my installation to use a cigarette-receptacle adapter and a DB9-DC splitter. This ensures that the CANedge power supply is linked to the vehicle ignition, thus avoiding any risk of battery drainage.
An alternative way that I also tested was to use the CANedge 'control signal' to start/stop transmission based on the GPS-based vehicle speed. This way I could stop transmission when the vehicle was standing still. This reduced the cables required, though also implied that I would not get data during e.g. red lights or traffic queues.
In order to add GNSS/IMU data to the log files from the Kia EV6, I originally also connected the CANmod.gps to the 2nd port of the CANedge2. The CANmod.gps would then be installed within the vehicle via 3M velcro tape so as to ensure a stable installation during driving. As part of this, I measured the CANmod position in the car to adjust the configuration of the device. This in turn lets me leverage the sensor fusion capability of the CANmod.gps (providing precise positioning even in GNSS hostile areas), as well as adding valid data on e.g. the car's attitude (roll, pitch, yaw).
Note: In 2024, we updated the dashboard playgrounds to re-map the CANmod.gps data as if coming from an internal CANedge GPS/IMU, since this is now the most common and low cost way of adding this data to your log files.
 See our UDS intro
for details on CAN ISO TP communication
See our UDS intro
for details on CAN ISO TP communication
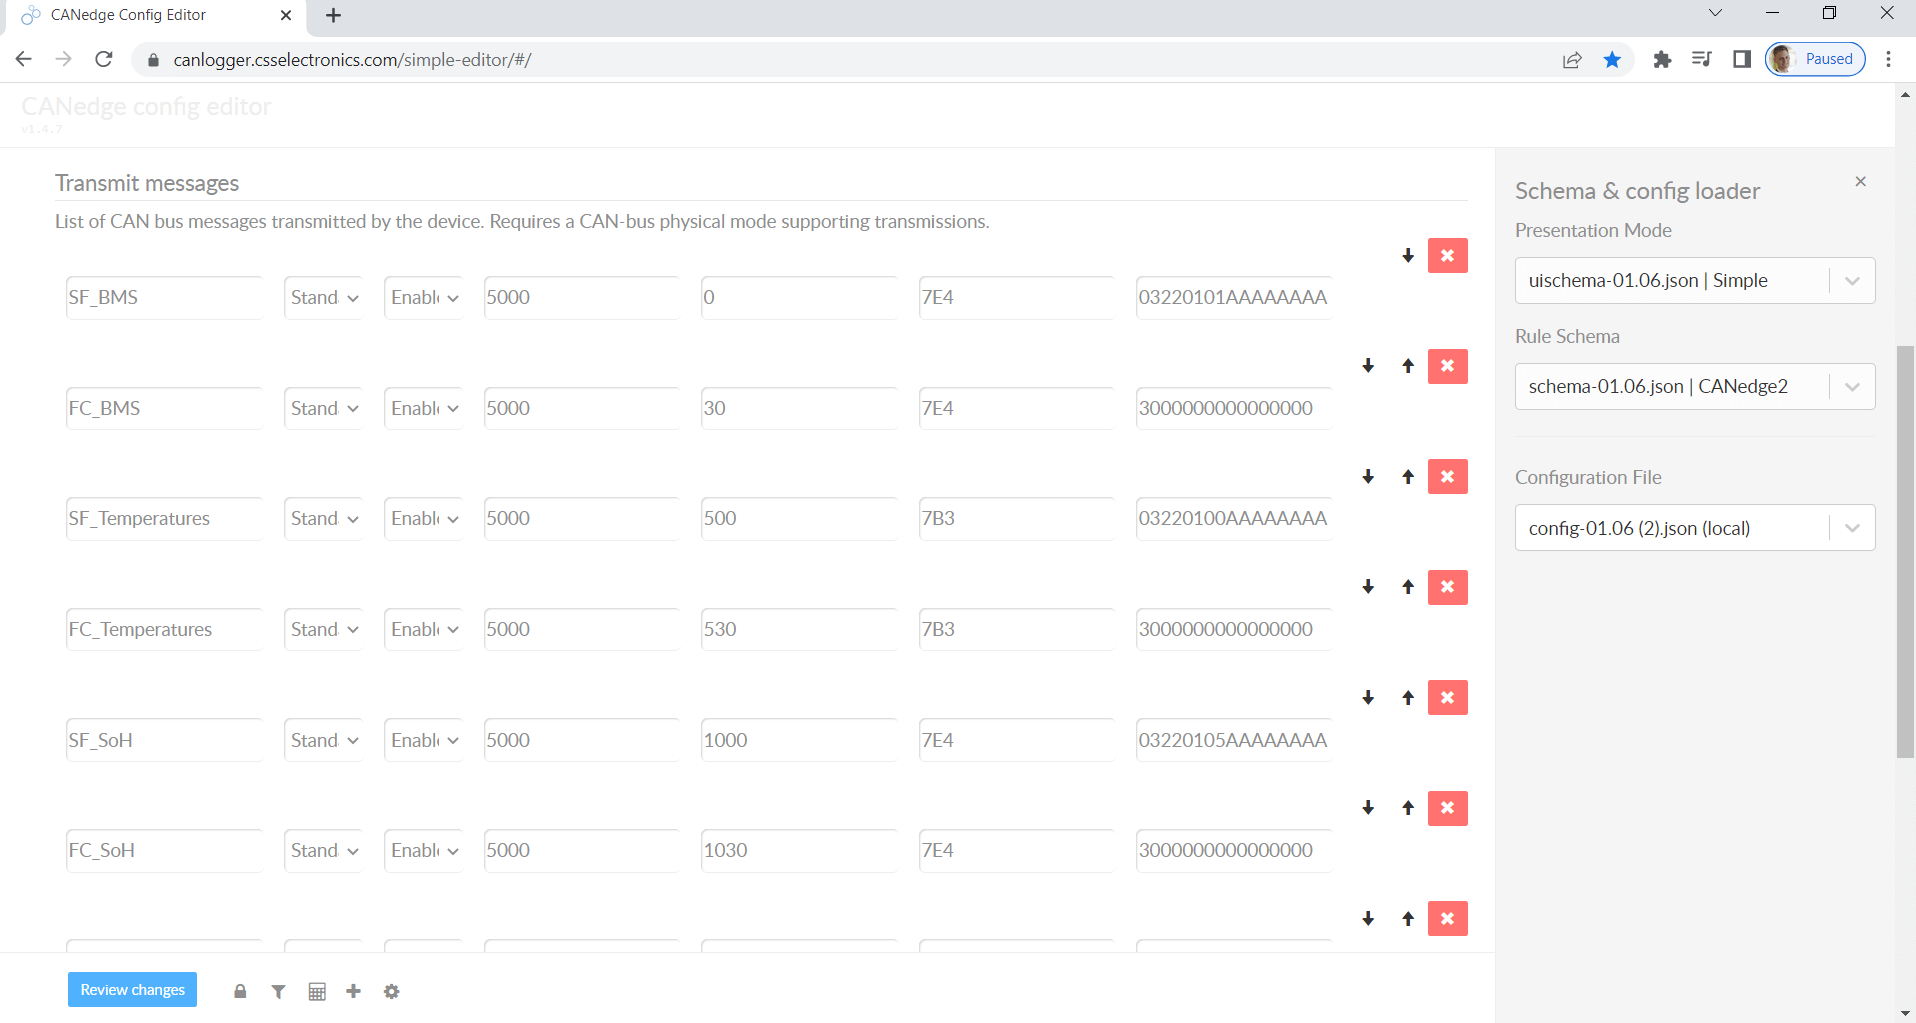
The UDS requests are added in the 'data pack' config file
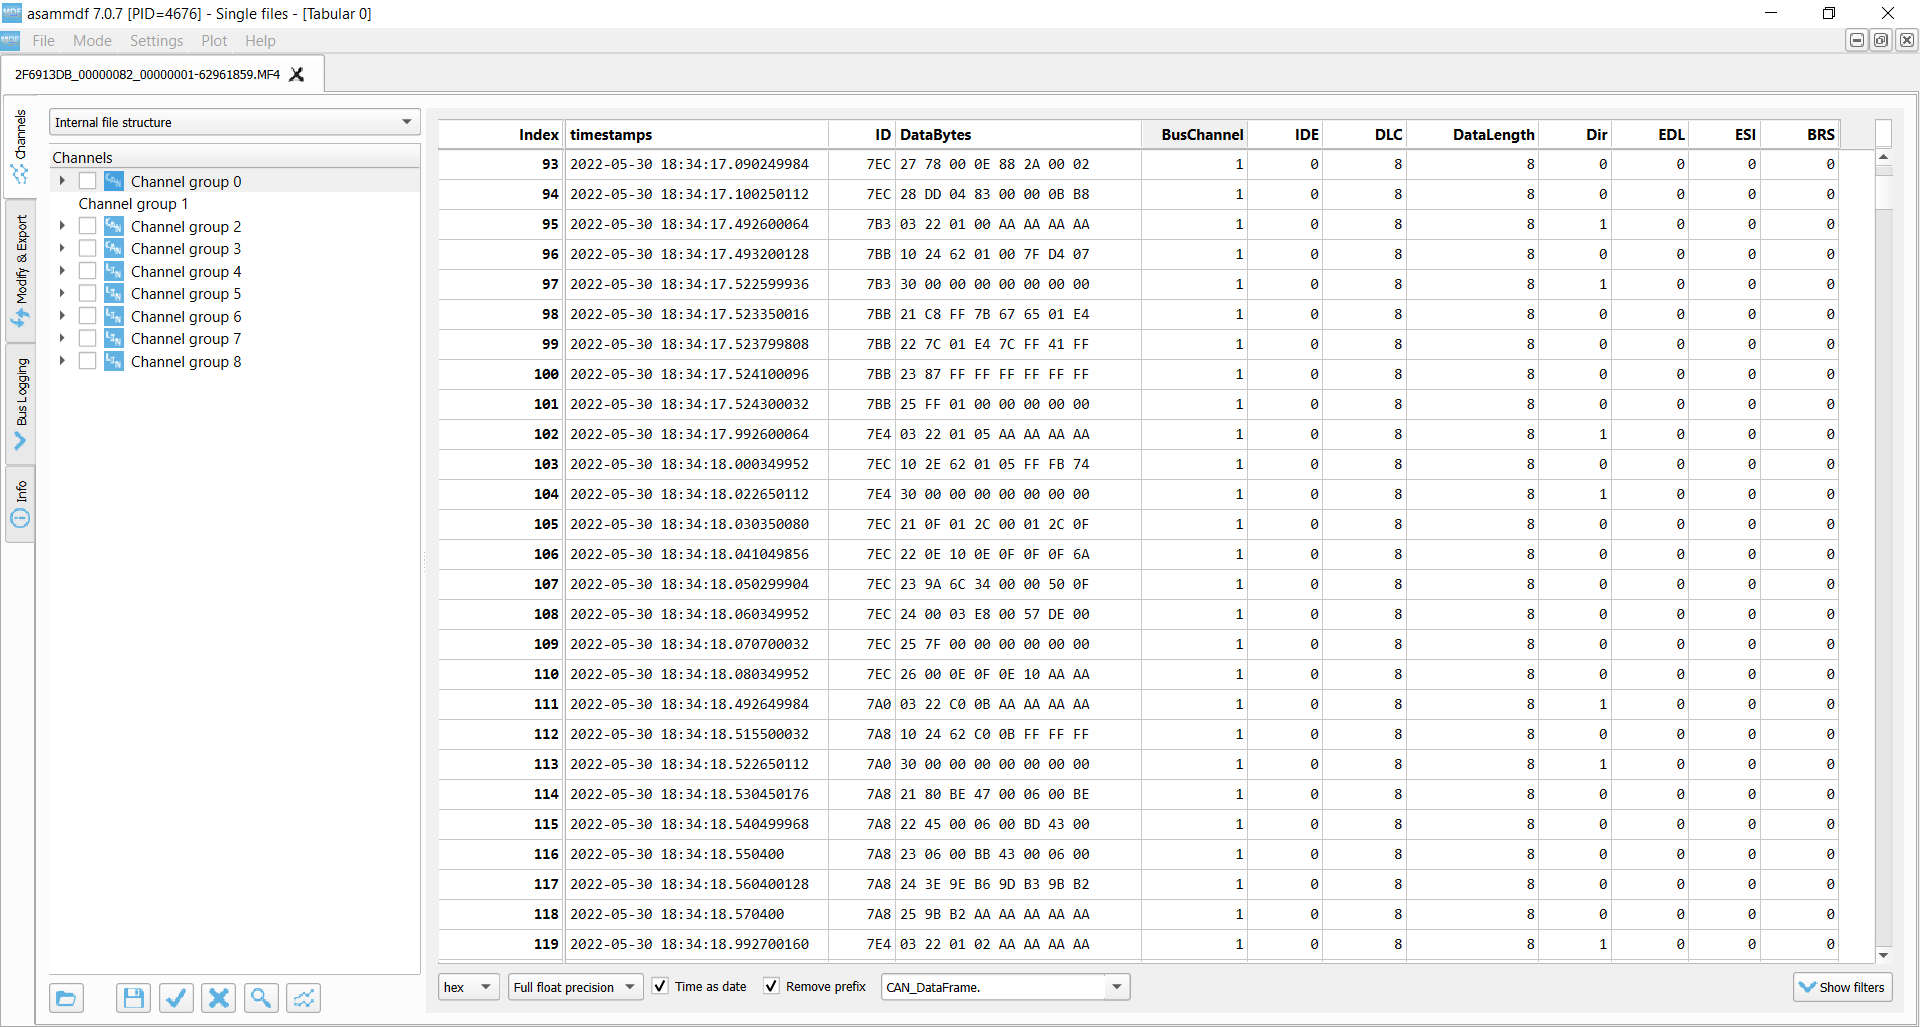
asammdf can be used to review the multiframe responses
Analyzing raw data and creating a DBC
Once I had some MF4 log files from the car, I used the asammdf GUI to analyze the raw data via the CAN bus trace view. I also made sure to note down physical observations on key parameters like state of charge, outdoor temperature, tire pressure etc. to allow me to validate the decoding of the data.
With this information and the online github decoding rules, I managed to create a full DBC file covering ~60 CAN signals incl. State of Charge (SoC), State of Health (SoH), cell voltages, temperatures (battery, outdoor, indoor) and more. These signals were in addition to the ~40 CAN signals from the CANmod.gps.
However, the asammdf GUI is not able to decode multi-frame ISO TP data - and hence we instead use our Grafana-Athena dashboard integration for this purpose, as outlined in the next section.
Below are a complete list of signals that were accessible and verified from the Kia EV6:
Battery
- BatteryAvailableChargePower
- BatteryAvailableDischargePower
- BatteryCurrent
- BatteryDCVoltage
- BatteryFanFeedback
- BatteryFanStatus
- BatteryHeaterTemperature1
- BatteryMaxTemperature
- BatteryMinTemperature
- BatteryTemperature1
- BatteryTemperature2
- BatteryTemperature3
- BatteryTemperature4
- BatteryTemperature5
- BatteryVoltageAuxillary
- BMSIgnition
- BMSMainRelay
- CCC_CumulativeChargeCurrent
- CDC_CumulativeDischargeCurrent
- CEC_CumulativeEnergyCharged
- CED_CumulativeEnergyDischarged
- CellVoltage01
- CellVoltage02
- CellVoltage03
- CellVoltage04
- CellVoltage05
- CellVoltage06
- CellVoltage07
- CellVoltage08
- CellVoltage09
- CellVoltage10
- CellVoltage11
- CellVoltage12
- CellVoltage13
- CellVoltage14
- CellVoltage15
- CellVoltage16
- CellVoltage17
- CellVoltage18
- CellVoltage19
- CellVoltage20
- Charging
- MaxCellVoltage
- MaxCellVoltageCellNo
- MinCellVoltage
- MinCellVoltageCellNo
- MinDeterioration
- MinDeteriorationCellNo
- NormalChargePort
- OperatingTime
- RapidChargePort
- StateOfChargeBMS
- StateOfChargeDisplay
- StateOfHealth
Other
- IndoorTemperature
- OutdoorTemperature
- VehicleSpeed
- TirePressureFrontLeft m4
- TirePressureFrontRight m4
- TirePressureBackLeft m4
- TirePressureBackRight m4
- TireTemperatureFrontLeft m4
- TireTemperatureFrontRight m4
- TireTemperatureBackLeft m4
- TireTemperatureBackRight m4
For an overview of the CANmod.gps signals, see the CANmod.gps product page.
Prior to this project, no public DBC file exists covering the Hyundai/Kia electric vehicles. Rather, the existing formats on github are in a CSV-style file format with extensive cleaning and reformatting required.
To adapt the UDS-style multiframe response data from the Kia EV6 into the DBC file format, I leveraged the same extended multiplexing approach used in e.g. our Nissan Leaf case study. Specifically, we assume that a software tool (our Python API) is used to reassemble all multiframe CAN frames into single CAN frames with lengths exceeding 8 bytes. The 1st byte of the reassembled CAN frames is the UDS Service Identifier (SID), while the next 2 bytes are the UDS Data Identifier (DID). Together, these serve as multiplexors in a similar way as the OBD2 PID in our OBD2 DBC file.
With that in place, it's a fairly simple matter of "translating" the data from the github CSV style to the DBC file format. As part of this, I would validate the data vs. the physical values I could identify from the car's dashbboard, resulting in some minor modifications to e.g. the tire pressure scaling factor and a few other signals.
Creating Grafana dashboards to visualize the EV data
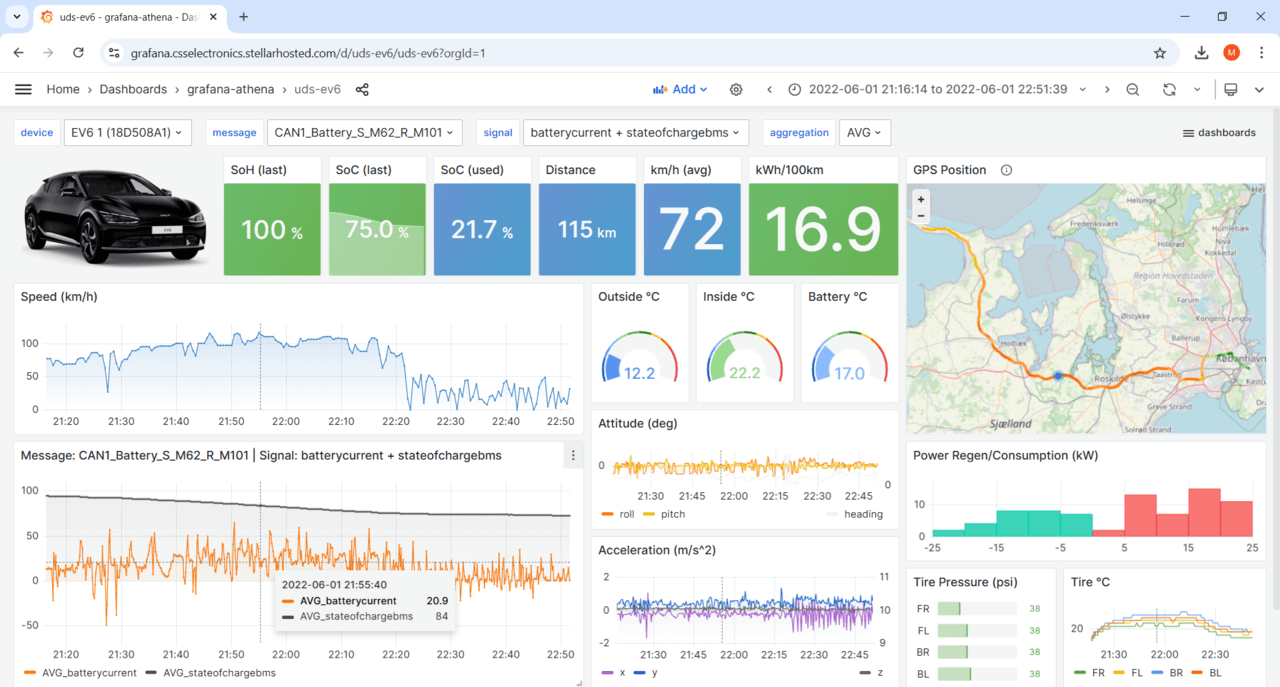
Next, I wanted to visualize the data in Grafana dashboards - creating 3 dashboards in total: A device dashboard, trip summary dashboard and event summary dashboard.
Note: You can find step-by-step guidance on setting this up in the CANedge Intro.
#1: Device dashboard
As a first step, I deployed our Grafana-Athena dashboard integration, which leverages our free MF4 decoders. Importantly, the MF4 decoders support ISO-TP, enabling us to easily decode the multi-frame UDS responses from the EV6.
To get started, I processed my entire 10,000+ km data set locally, then uploaded it to our S3 'output bucket' where our dashboard playgrounds are stored. In turn, this allowed me to build our EV6 Grafana dashboard playground. This is a simple method for adding a historical 'backlog' of data to an existing data lake. However, our guide for setting up Grafana-Athena also involves deploying an AWS Lambda function, which ensures that log files are automatically processed as soon as they are uploaded by a CANedge2/CANedge3 to S3.
As part of the dashboard creation, one challenge I wanted to solve was to display 'efficiency' in the form of kWh / 100 km - see below for details.
A key signal displayed in the Kia EV6 is kWh / 100 km, serving as a measure of your ability to drive efficiently. The Kia EV6 range of ~500 km is based on an assumption of ~15 kWh / 100 km (est. 74 kWh capacity). As such, adding this parameter to my dashboard would be insightful.
One challenge, however, is that the kWh / 100 km is not an available signal from the github resource. In other words, I had to calculate it as a derived signal.
This can be done by creating two Athena queries in a single panel:
- The first returns a custom signal, Watt, calculated by multiplying Current and Voltage and taking the average. It is important not to take the average of Current and Voltage before multiplying, due to the non-linear nature of the kWh/100km formula
- The second extracts average Speed in m/s from the GPS/IMU
With these values, we can then use Grafana Transformations to create a calculated signal, kWh100km, equal to (Watt / Speed) * 0.027777778, with the factor being related to the fact that we're measuring speed in m/s.
At a later stage in my analyses, I decided to create a 'custom Parquet table' containing both Current, Voltage and Speed. This in turn enabled me to simplify the panel. However, you can still find similar multi-query kWh/100km examples in the other EV dashboard playgrounds.

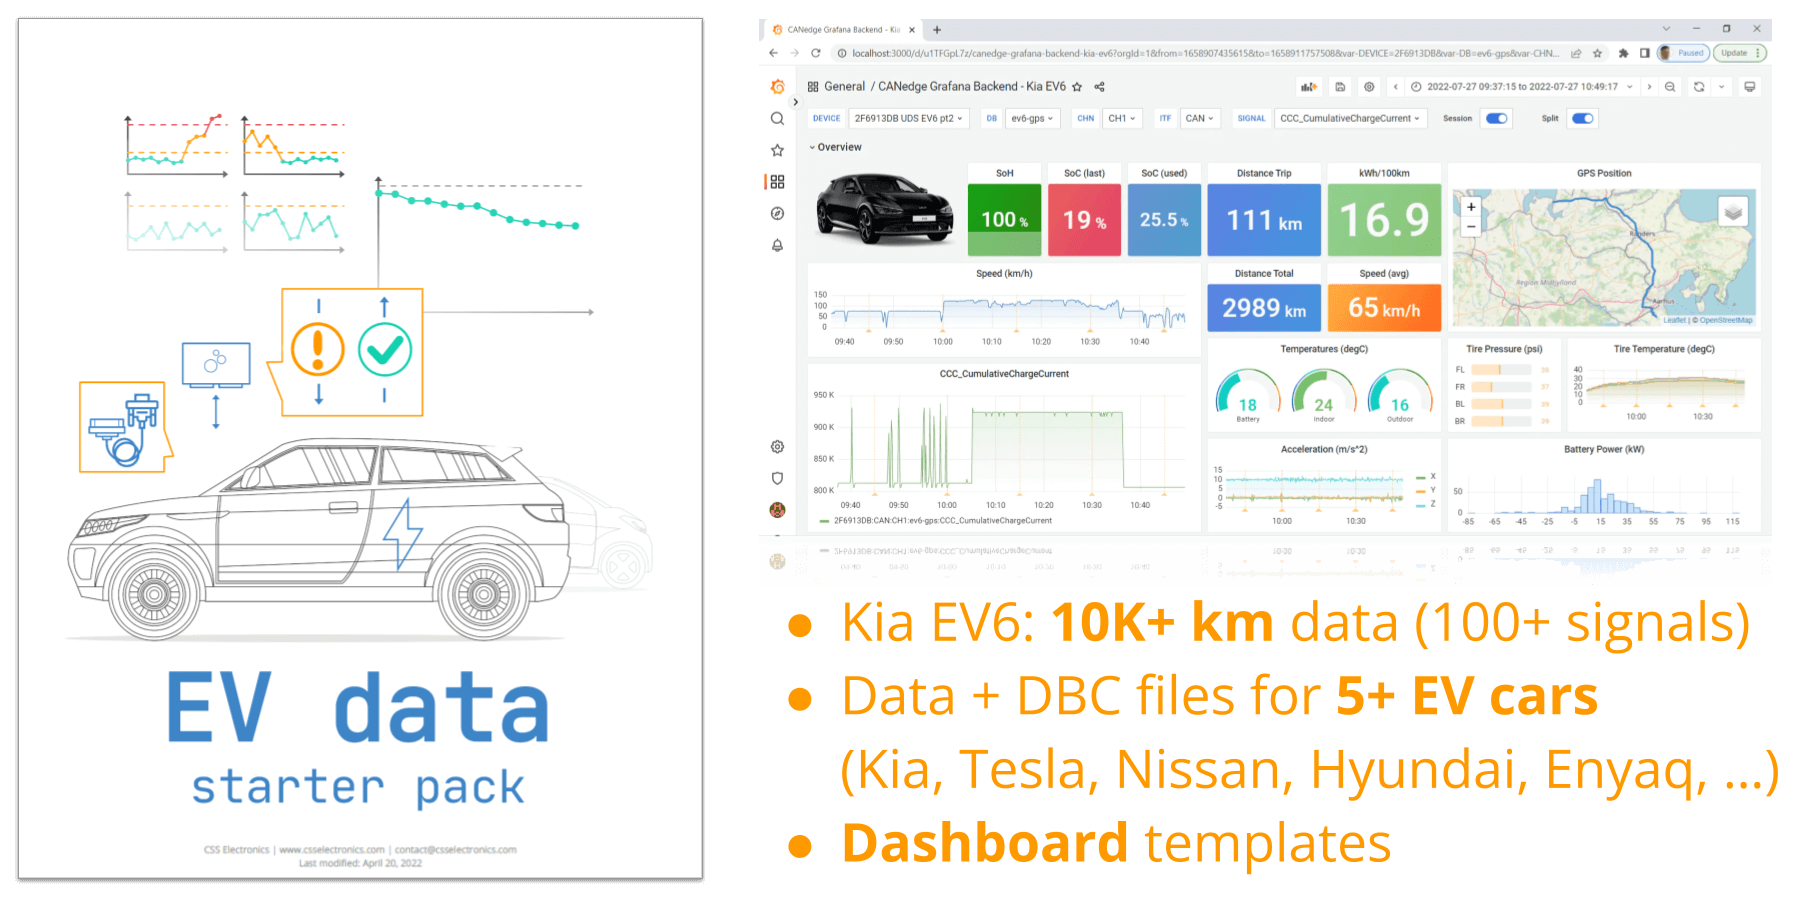
Get the 'EV data pack'
Want to work with real electric car data?
Download your 'EV data pack' - incl. sample data, configuration files & DBC files from popular electric cars:
- Kia EV6 (10K+ km data)
- Nissan Leaf
- Tesla Model 3
- Skoda Enyaq
- and more ...

#2: Trip summary dashboard
The device dashboard is great for looking at a single device and a single trip. It also flexibly allows you to shift between multiple devices, time periods and CAN signals.
However, it did not easily allow me to get a high level perspective across my 10,000+ km of driving and 1,000+ trips. Further, I would not be able to benchmark data across multiple vehicles with the device dashboard (as it is designed to display data from one device at a time).
To solve this, I deployed 'trip aggregation', an advanced feature of the Grafana-Athena integration. Specifically, I set up a Python script (as an AWS Glue job) to perform a daily, customized aggregation of data and output the resulting summary statistics into the Parquet data lake.
With the aggregated data stored, I could then deploy our 'trip summary dashboard' template to visualize it. This made it easy to filter through devices and trips of interest based on custom parameters like average kWh/100km, max temperature, trip duration or start position. Further, I can now click trips of interest to jump into the device dashboard for that device/period - enabling a powerful 'zoom in' work flow.
Our default 'trip aggregation' methodology enables trip aggregations that involve a single CAN signal (e.g. average of speed, max of temperature). This can be easily extended with 'custom aggregations' to also support functions based on multiple signals in the same CAN message aka Parquet table.
However, the default aggregation methodology does not easily support cross-message signal calculations, which is required by default to calculate kWh/100km as a custom signal.
Luckily, another 'advanced feature' of the Grafana-Athena integration enabled me to create 'custom signals' in a simple manner. Specifically, I created a custom table with Current, Voltage and Speed resampled to a 5 second raster (the frequency at which Current and Voltage is available at).
Having created this table across the full data set, I could now extend the trip aggregation with a custom signal for kWh/100km - and also use the new custom table as the basis for kWh/100km in our device dashboard.
#3: Event summary dashboard
Finally, I wanted to identify specific events in the data - e.g. speeding, high acceleration or entering/exiting certain areas. I also wanted an immediate notification by email if an event of interest occurred.
To do so, I deployed 'CAN signal alerts' - another advanced feature of the Grafana-Athena integration.
Specifically, I modified my AWS Lambda function by using a pre-made script designed for event identification and notification. By modifying a few lines of code, I could add multiple custom event triggers relevant to my data and use case. After deploying the updated Lambda, I could verify that the email notifications worked as intended.
The new Lambda produced a Parquet file in my data lake for each event. As part of the deployment, I processed my entire backlog of historical data to output the entire event history. After this, I deployed our 'event summary dashboard', letting me visualize all the historical events in Grafana.
What benefit has this led to?
This Kia EV6 serves to showcase the versatility of the CANedge for collecting data from any CAN based application - incl. higher layer protocols like UDS. Further, it illustrates the power and flexibility of the Grafana-Athena integration - including the advanced features like trip/event summary dashboards.
The config and DBC can be reused by others to log and decode data across various Kia/Hyundai electric vehicles. Further, for those who simply want to 'play around' with large EV datasets, the free 10K+ km dataset offers a great platform for creating your own Grafana dashboards or performing big data analysis.
— Martin Falch, co-owner at CSS Electronics
Ready to log data from your EV?
Get your CAN logger today!


