CAN Bus Signal Events/Alerts - Identify, Notify & Visualise

Need to identify CAN bus signal events - and notify users?
The CANedge logs CAN/LIN data from e.g. vehicles/machinery. Data is stored on an SD, pushed to your server via WiFi/LTE and can be decoded/visualized via our Grafana-Athena integration.
In this intro we explain how you can extend your integration to identify events of interest (e.g. high temperatures, harsh braking, DTCs, ...), set up email/SMS alerts - and visualize the events via Grafana-Athena dashboards.
Learn more below - and try our dashboard playground!

 DEPLOY IN 15M
Extend our ready-to-use event detection scripts to deploy in minutes
 CUSTOMIZABLE
Fully control what CAN/LIN signal events to identify and how
 STORE EVENTS
Automatically store event meta data in your S3 Parquet data lake
 NOTIFY
Trigger immediate email/SMS/... alerts when events arise via AWS SNS topics
 VISUALIZE
Browse historical fleet events via Grafana dashboards
 SCALE
SCALE
Easily scale from 1 to 1000+ CANedge devices across multiple alert rules
Open the dashboard playground - or deploy your own dashboard in < 15 min!
How do the custom events/alerts work?
Below we outline a Grafana-Athena setup with 'event detection':
- A CANedge uploads raw CAN/LIN data to an AWS S3 bucket
- When a log file is uploaded it triggers a Lambda function
- The Lambda function DBC decodes the data to Parquet files
- The Parquet files are written to an AWS S3 'output bucket'
- In the Lambda, an 'alert function' identifies CAN signal events
- If events, meta Parquet files are written to the output bucket
- Further, a notification message is sent to an AWS SNS topic
- Grafana-Athena is used to visualize data incl. events
Adding the event workflow can be done in <15 minutes.

When you deploy the default Grafana-Athena integration, event detection is already built-in. All you need to do is to upload an events.json file to your input S3 bucket. In this file, you provide details on the specific CAN signal events you want to detect. The Lambda function then automatically fetches this events.json file whenever a log file is processed - allowing it to evaluate the DBC decoded data for any events. No custom coding is required.
You can find the JSON syntax in the CANedge Intro under Process/MF4 decoders/Parquet data lake - advanced topics.
AWS Simple Notification Service is an AWS service designed to make it easy to application-to-application (A2A) or application-to-person (A2P) messages. The Lambda function deployed via the Grafana-Athena integration will have access to publish messages to a deployed SNS topic. End users can then 'subscribe' to the event SNS topic to be notified in their preferred manner (e.g. email, SMS, ...) when an event arises.
This methodology ensures that the notification aspect of the event detection script is kept simple, as all of the complexity is abstracted away through the use of AWS SNS. It also makes it very easy to e.g. add/remove subscribers over time.
You can control the frequency of MDF files being uploaded by the CANedge2/CANedge3 through the log file split size/time. For example, you may set up a CANedge3 to split files every 5 minutes. If an event arises within such a log file, you will of course face a 'delay' of up to 5 minutes due to the log file split time, plus a number of seconds for the file transfer and the Lambda/SNS execution.
In other words, you will face some delay from an event arising to the event notification being sent. However, for most use cases (like predictive maintenance), this level of delay is not a practical issue - and it will typically be negligible vs. the time it takes to react by the end user.
It may be tempting to set your file split size/time lower to minimize the delay. For example, you could in principle split files every 10 seconds. However, doing so will increase file size, data transfer costs, AWS costs - and reduce the efficiency of your Parquet data lake (due to a higher number of files). In addition, for some event types it can increase the risk of 'false negatives' as explained further below. We generally recommend using a more balanced split of 5-30 minutes for near-real time event detection use cases.
Yes, you process a backlog of data locally with the event detection enabled, thus allowing you to test e.g. the specific thresholds you set. Of course, using a CANedge2/CANedge3 is necessary if you want to be immediately notified when an event arises in the field - and hence most of this intro takes outset in this device.
Yes, the Grafana-Athena integration automatically deploys resources for easily processing a backlog of data from your input bucket. To do this, you simply upload a JSON file to your input bucket with details on what devices/folders you wish to process. After this, you can run a backlog processing 'Glue job' via one click in AWS. This backlog job will use the exact same code and functionality as the Lambda function when processing your historical data - which means that any historical events will also be detected, with the relevant meta information added to your data lake. Notifications will automatically be disabled when processing a backlog, to avoid excessive email/SMS messages being sent.
Examples of CAN bus signal 'event objects'
In this section we provide practical examples of custom CAN signal event objects.
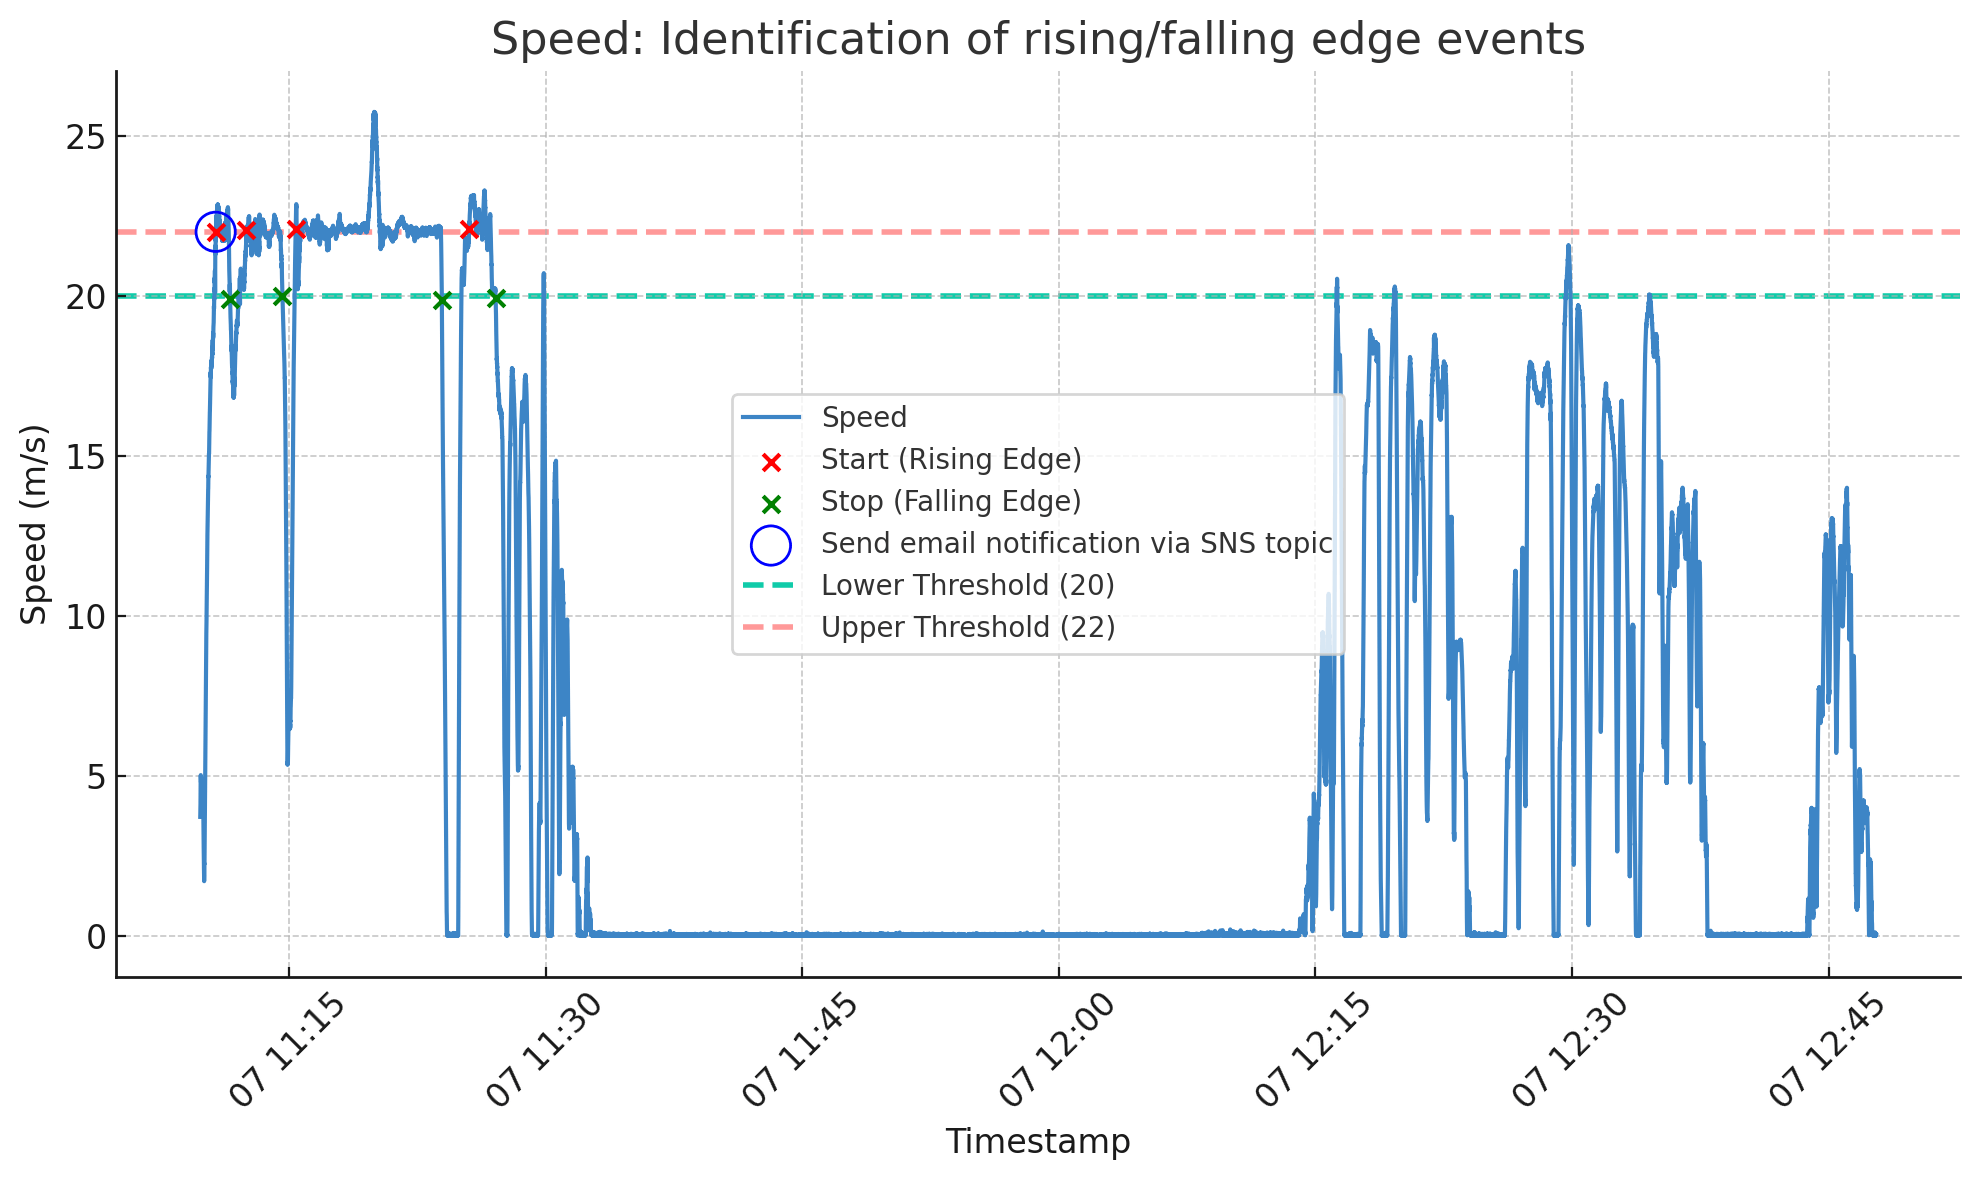
Example 1: High-speed events
You may want to identify cases where the vehicle speed exceeds a certain threshold. To do so, you can define an event focused on the CAN signal 'Speed' from the message 'CAN9_GnssSpeed'.
The event object specifies that if Speed moves from below the lower threshold (20 m/s = 72km/h) to above the upper threshold (22 m/s = 79 km/h), we consider this a 'start event'. If Speed then falls below the lower threshold, we consider this a 'stop event'.
In the graph, we plot Speed from a CANedge log file, showing the detection of 4 events. As evident, the lower/higher thresholds create a 'hysteresis interval', which ensures that only significant changes constitute new events.
The Lambda will evaluate every log file in isolation - and detect events in a similar way. As the plot shows, a single log file can have multiple events arise - but only the first event detection will trigger a notification through the AWS SNS topics resource.
It should be noted that the plug & play event detection script we provide does not support the detection of events that arise between log files. In the automated setup, the Lambda file will by default only have access to information contained within the single log file it is processing. As an implication, the methodology cannot detect an event that crosses between log files.
To explain this, consider the previous example 1 where we aim to detect speeding events. It could be that 'log file 1' ends with a speed of 19 m/s (below our lower threshold) and 'log file 2' starts at 21 m/s (within our hysteresis interval), then later crosses above our upper threshold of 22 m/s once in 'log file 2'. In this scenario, no event is detected because Speed did not rise from below 20 m/s to above 22 m/s within a single log file - even though it did constitute an event if the two log files were considered as a whole. In other words, there is a risk of 'false negatives'.
This limitation is caused by the fact that the event detection methodology does not attempt to manage 'state' information between log files. In practice, you can minimize the risk of false negatives by increasing your log file size and tweaking the thresholds accordingly.
"event_name": "HighSpeedAlert",
"messages_match_type": "equals",
"messages_filtered_list": [["CAN9_GnssSpeed"]],
"trigger_signals": ["Speed"],
"lower_threshold": 20,
"upper_threshold": 22,
"rising_as_start": True,
"exact_match": False,
"raster" : "0.2s"
}
"event_name": "DM01_DTC_01_Active",
"messages_match_type": "contains",
"messages_filtered_list": "_DM01_DTC_01",
"trigger_signals": ["DM01_01OC"],
"lower_threshold": 0,
"upper_threshold": 1,
"rising_as_start": True,
"exact_match": False,
"raster" : "1s"
}
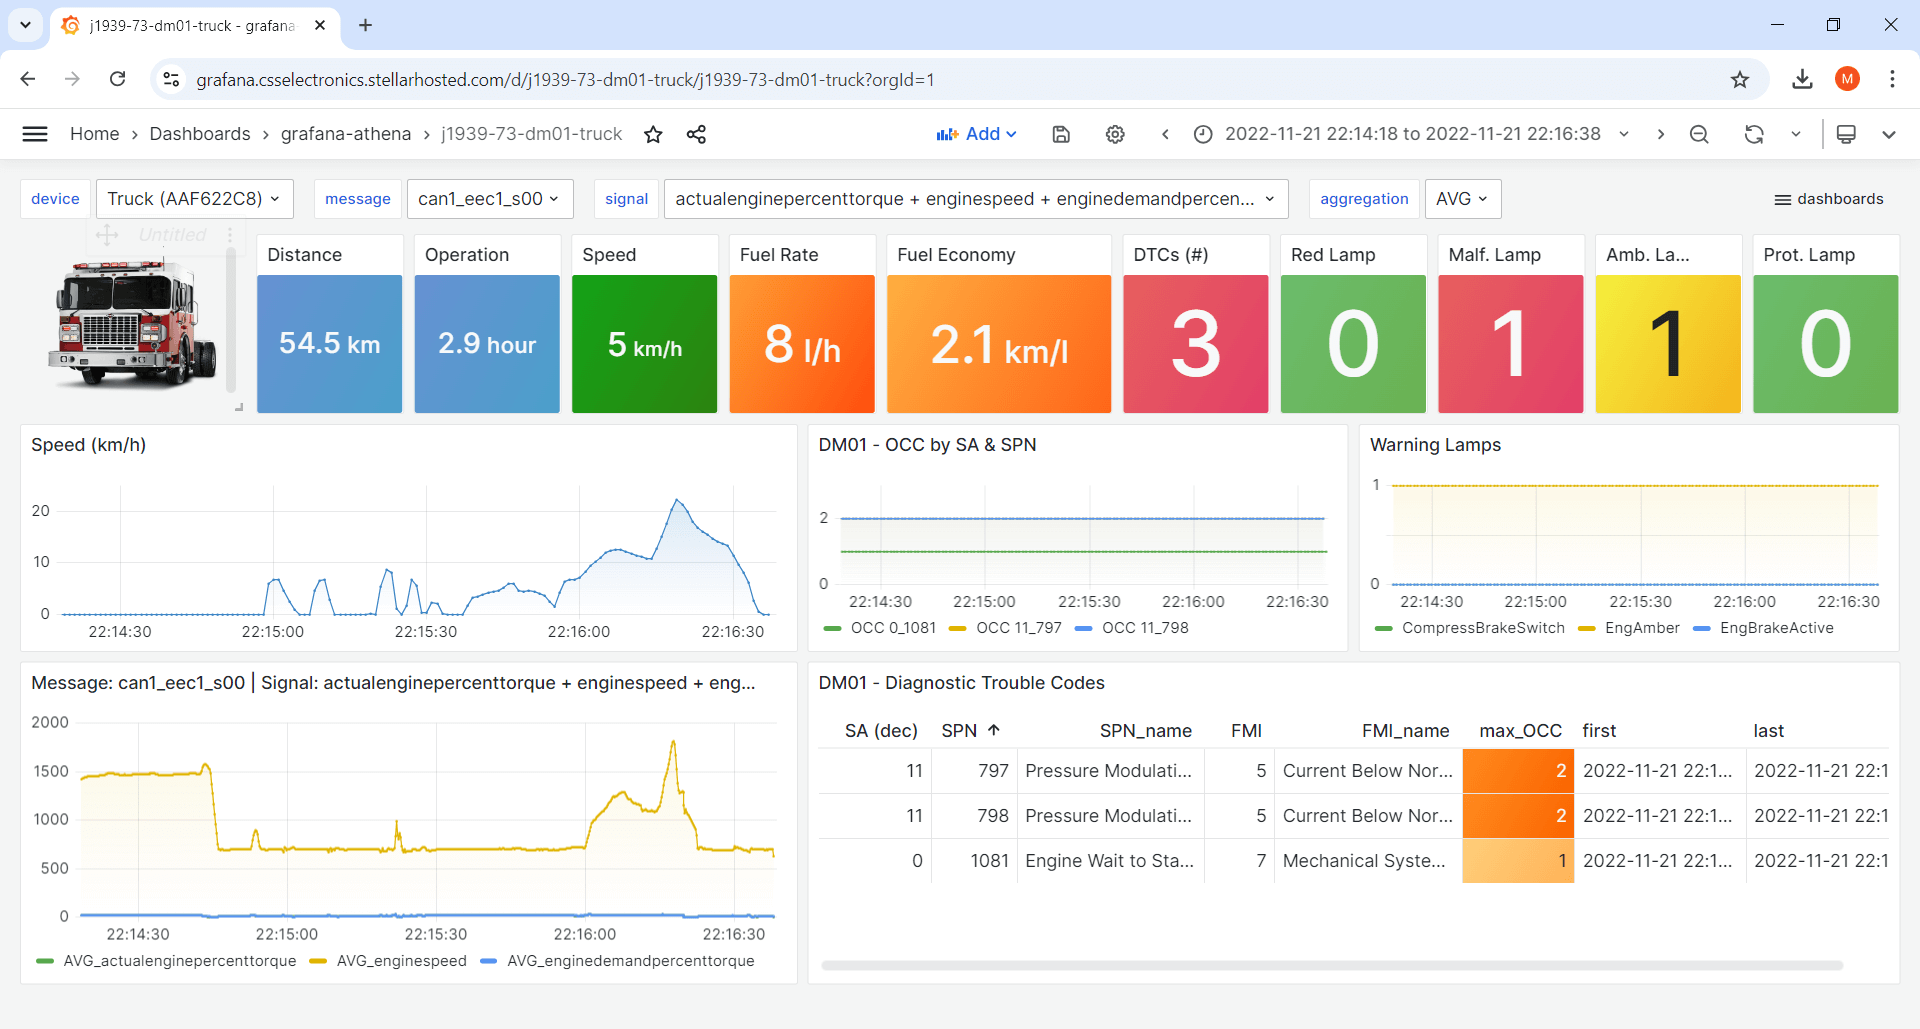 Device dashboards can visualize detected DTC
events (playground)
Device dashboards can visualize detected DTC
events (playground)
Example 2: Active J1939 DTC events
In heavy-duty J1939 data logging, the DM1 message is often of interest as it carries Diagnostic Trouble Code information as per J1939-73 (PGN 0xFECA, 65226). Normally, scraping through GBs of data to identify the 'rising edge' where DTCs become active can be cumbersome - and for some use cases, you may need to be notified immediately upon such an event via email or SMS. In comparison to Example 1, however, two things can add complexity:
First, the DM01 message has a variable length depending on the number of active DTCs - and will often be transported via the J1939 transport protocol. Fortunately, the MF4 decoders used in the Lambda support J1939 TP - and by providing your J1939-73 DBC file as per our guidance, you can handle the 'variable' length challenge as well.
Secondly, the MF4 decoder will by default separate J1939 data by source address. This means that there can be several separate DM01 tables for a single device. To solve this challenge, the event JSON lets you match multiple messages based on whether they 'contain' a specific string. This effectively lets you list all DM01 messages (across CAN channels) - and evaluate the event for each of them in sequence, as per the illustrated object definition. We can then use the DM01 occurrence count signal as our event signal and trigger the event when this goes from 0 to 1+.
Example 3: Custom signal events
You can also combine event identification with 'custom signals' (another advanced Grafana-Athena feature).
For example, you can check if your device is inside a set of custom geofences. Your custom CAN signal can be defined as an integer geofence ID (with 0 indicating no geofence). This signal can be written to a Parquet table (like your other CAN messages/signals) in your data lake. Importantly, within the same Lambda script invocation, the table can also be used as the basis for your event detection. To illustrate this, see the event object where we check whether a device has 'entered Copenhagen' (one of our geofence areas) by checking if it is initially outside (GeofenceId 0) and subsequently inside (GeofenceId 4). Here we set 'exact_match' to True to only detect an event if we move from 0 to 4 (and not e.g. if we move from 0 to 5).
"event_name": "EnteredCopenhagen",
"messages_match_type": "equals",
"messages_filtered_list": [["CAN9_CALC_CustomGeofences"]],
"trigger_signals": ["GeofenceId"],
"lower_threshold": 0,
"upper_threshold": 4,
"rising_as_start": True,
"exact_match": True,
"raster" : "1s"
}
 Geofences can be added as custom signals and used for
event detection
Geofences can be added as custom signals and used for
event detection
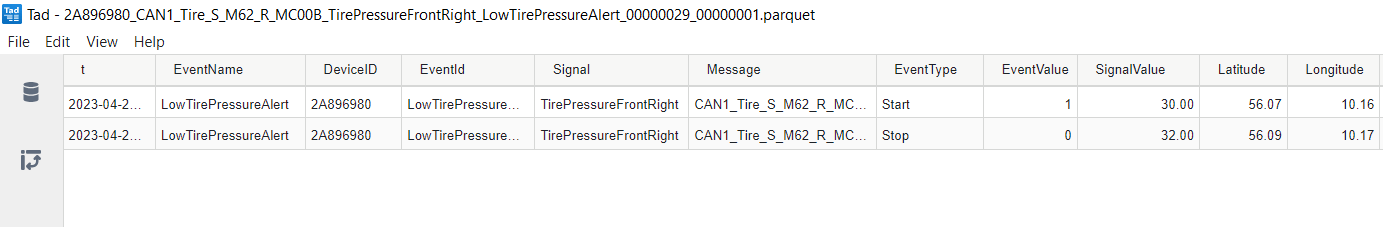 Detected events are stored as Parquet files in S3
 Grafana-Athena can visualize historical events across all devices
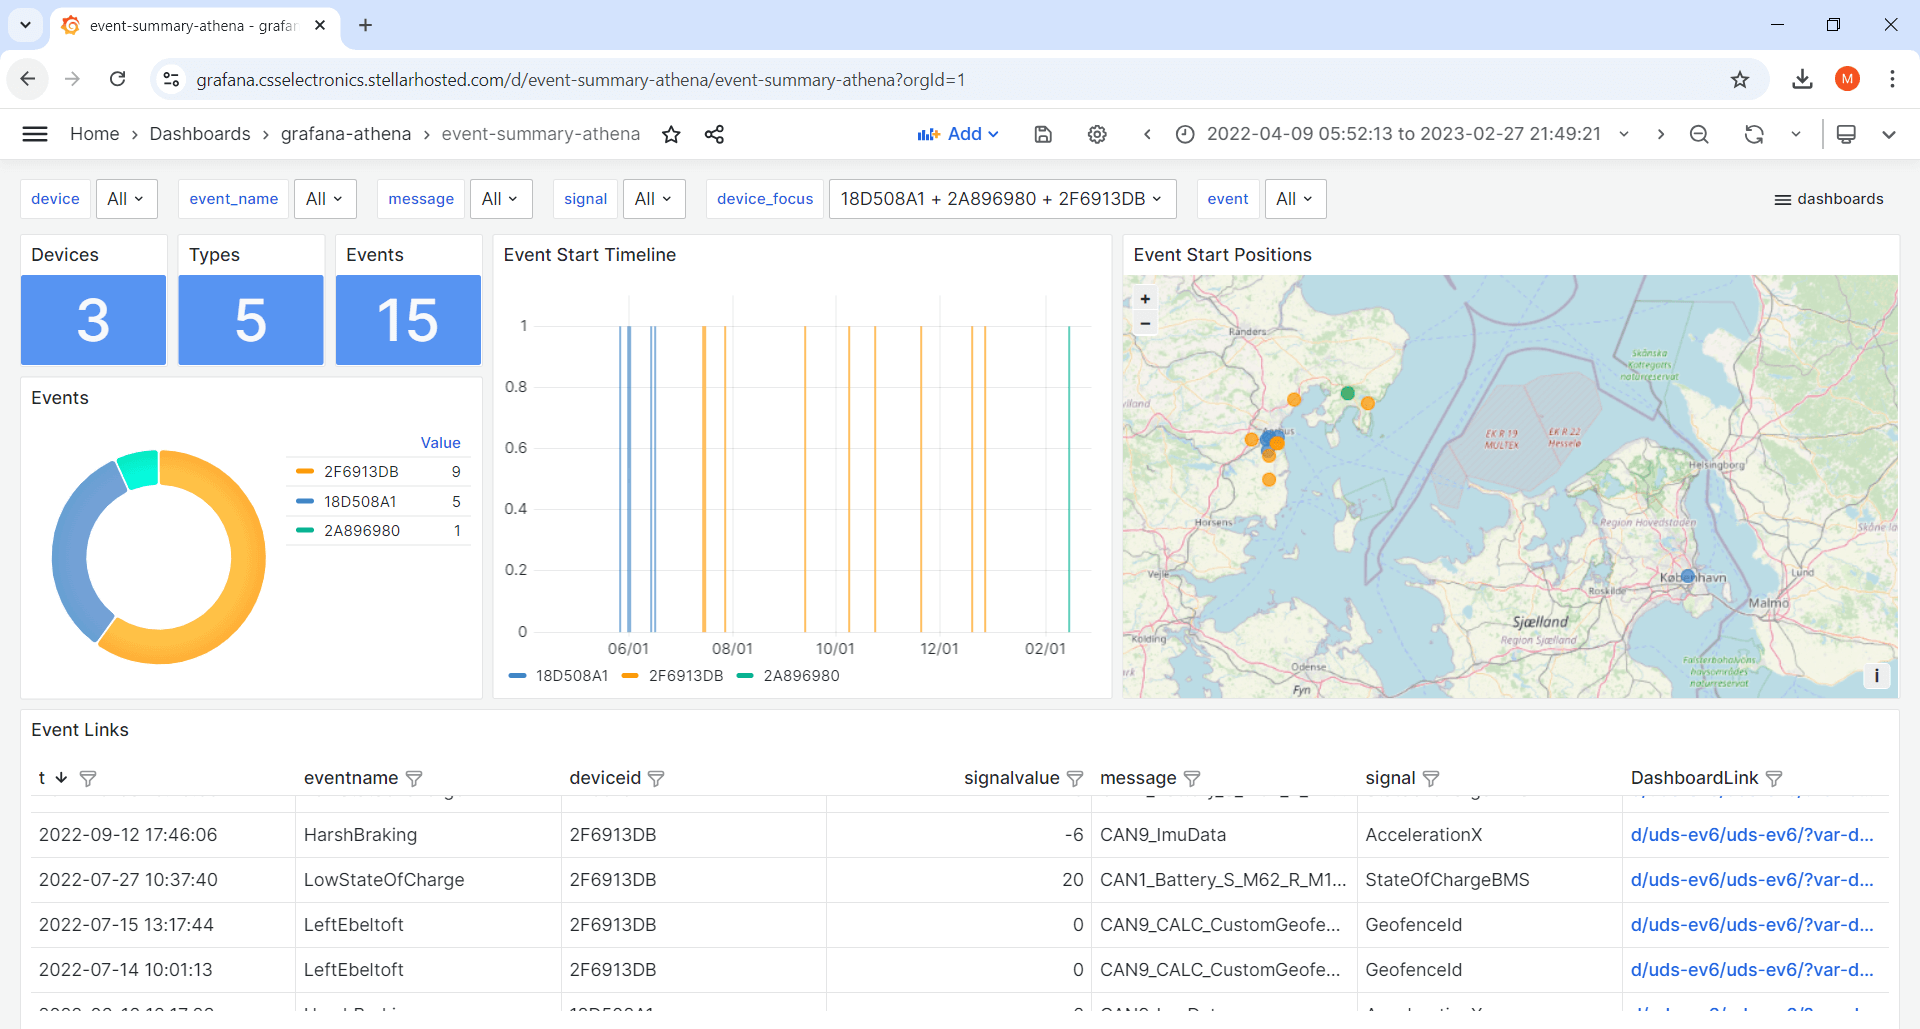
Event summary Grafana dashboard
While it is useful to be notified when an event occurs, it is also critical to be able to easily review historical events.
To enable this, the event detection function outputs Parquet files to your AWS S3 output bucket when events are detected, including information on the device, event name, start/stop timestamps and more. This data can be visualized via Grafana-Athena and we provide an 'event summary dashboard template' for this purpose. This lets you identify historical events of interest - and quickly jump into a detailed device dashboard to visualize the full-resolution CAN/LIN data surrounding the event.
Set up predictive maintenance across vehicle fleet
Want to be notified about critical events across your fleet?
You can deploy the CANedge2/CANedge3 across a fleet of vehicles to collect data to your own AWS S3 bucket, automatically DBC decode it and visualize it in telematics dashboards using Grafana-Athena. By enabling event detection, you can easily set up alerts for critical events such as low tire pressure, DTCs, speeding, entering/exiting geofences and more. Through the AWS SNS topic functionality, you can add/remove subscribers and select the method (email, SMS, ...).


Super charge your big data CAN/LIN diagnostics
Need to drastically speed up your troubleshooting and diagnostics?
A common use case for the CANedge is to collect data across a fleet of prototype vehicles for analysis by OEM engineers. The goal may be to capture intermittent events for diagnostic purposes and troubleshooting. This is often done reactively and ad hoc based on feedback from the field. However, by using event detection, you can immediately spot events of interest based on custom logic defined by your team. You can also process all of your historical data, which you can then visualize/browse via Grafana. Here, built-in links allow you to quickly 'zoom in' to visualize an event of interest in full-resolution detail.
Deploy advanced telematics automation workflows
Want to trigger new workflows in response to events?
For advanced users, the event functionality can be used as a starting point for designing more advanced workflows, incl. application-to-application (A2A) logic. As illustrated in this predictive maintenance case study, one example might be to make an AGV return to its base station if the battery temperature exceeds a certain threshold. Another use case can be to trigger an over-the-air update of the CANedge, e.g. to change filters or to transmit a sequence of custom CAN frames. Such examples are beyond the scope of our support, but the event detection functionality greatly simplifies deployment.

Ready to detect and visualize your CAN signal events?
Get your CANedge today!