J1939-73 Diagnostics Explained - A Simple Intro [DM1, DTCs]

Need a simple intro to J1939-73 and heavy-duty vehicle diagnostics?
In this guide we introduce the J1939-73 standard with focus on the Diagnostic Message 1 (DM1) which contains active diagnostic trouble codes (DTCs). We explain this PGN in detail including real-life CAN bus trace examples.
Further, we show how you can log and DBC decode J1939 diagnostic messages to visualize DTC information in e.g. Grafana dashboards - including practical use cases.
Tip: See also our intro to J1939 and J1939 data logging.
In this article

What is SAE J1939-73?
As explained in our intro to J1939, SAE J1939 is a set of standards that define how ECUs communicate via CAN bus in heavy-duty vehicles like trucks, buses and tractors.
In this context, the SAE J1939-73 (2022) standard defines 60 diagnostic messages for reporting, repair and compliance across heavy-duty vehicles like trucks, buses and tractors.
In particular, this includes the Diagnostic Message 1 (DM1), which contains the status of various diagnostic lamps and any active diagnostic trouble codes (DTCs). It also includes messages for clearing DTCs, emissions compliance and more.
J1939-73 also dictates the use of the J1939 connector (deutsch 9-pin as specified in J1939-13) for diagnostics communication.


J1939-73 vs. other J1939 standards
As evident from the OSI model shown in our J1939 intro, J1939-73 belongs to the application layer - along with J1939-71.
From a practical perspective, J1939-73 can be thought of as a supplement to J1939-71, specifically outlining the subset of J1939 parameters related to diagnostics (whereas J1939-71 outlines all other parameters). To fully interpret the data from a J1939 network, both the J1939-71 and J1939-73 standards are required.
J1939 vs. OBD: Regulatory compliance
As explained in our intro to OBD2, the On Board Diagnostics protocol was designed to standardize vehicle diagnostics and emissions control. OBD was initially mandated in cars and light-trucks, but later also in medium and heavy-duty vehicles.
In other words, practically all non-EV vehicles must comply with some variant of OBD regulation. For most cars, this is done via OBD2 - while in most heavy-duty vehicles it is done via J1939.
In this context, one of the primary objectives of J1939-73 is to define the diagnostic services required for OBD compliance at the application layer level. It is supplemented by mandatory real-time messages from the J1939-71 standard like speed, RPM etc. This is also referred to as HD OBD (Heavy-Duty OBD).
The J1939-73 document provides a detailed overview of which parameters must be supported to comply with different regulations. Below we show a subset of this overview.


In addition, the standard also provides a direct mapping between SAE J1939 parameters and their SAE J1979 counterparts (aka OBD2 PIDs), as illustrated in the table.
In terms of physical connectors, heavy-duty vehicles that comply with OBD through J1939 will typically achieve this by providing access through the J1939-13 diagnostic connector.
However, since 2014, newly developed heavy-duty vehicles must support WWH-OBD (World-Wide Harmonized OBD) through an OBD2 connector (as per the EURO-VI standards). These vehicles typically still rely on J1939 as the protocol for e.g. powertrain communication and they may therefore both support J1939 diagnostics (i.e. HD OBD) and WWH-OBD in parallel. In terms of physical connectors, these vehicles may include both the J1939 and OBD2 connectors, while some may include only the OBD2 connector (though in such cases they may expose the J1939 network via a secondary set of CAN high/low pins, as e.g. seen in the Volvo 2013 OBD2 pinout).
J1939 diagnostics in data logging
Beyond the regulatory motivation, J1939-73 plays a key role in allowing both manufacturers (OEMs) and aftermarket operators to better diagnose and troubleshoot issues in vehicles.
For OEMs, the ability to collect J1939-73 DTC information and analyze the surrounding data can be pivotal to speeding up new prototype vehicle development. And for e.g. fleet managers, J1939-73 DTCs provide critical information for both reactive/predictive maintenance and remote troubleshooting in telematics. We will cover this further below.

Diagnostic Message 1 (DM1) - Active DTCs
The J1939-73 document defines 60 different diagnostic messages referred to as DM1, DM2, ..., DM60.
The most important one is DM1 (PGN 65226 aka 0xFECA) also called 'Active Diagnostic Trouble Codes'. This message provides the status of diagnostic lamps and active diagnostic trouble codes (DTCs). It is used by ECUs to communicate their diagnostic status to other ECUs on the J1939 network.
Additionally, the lamp status signals determine the state of the physical lamp illumination on the driver's dashboard.


J1939 DM1 source addresses
When recording and evaluating DM1 data, it is critical to retain the source address related to the data. In J1939, the source address is part of the 29-bit CAN ID and essentially serves to identify which ECU is communicating a specific J1939 PGN. If the source address is lost (e.g. in the decoding process), DM1 data from multiple ECUs may be non-separable - effectively making it impossible to trace which ECU is experiencing what issues.
If we look at some practical J1939 log files recorded by the CANedge, we can see that the number of separate ECUs communicating the DM1 will typically be between 1-20. This is on a single J1939 network - heavy-duty vehicles may have multiple.
Note that when a DM1 is communicated using the J1939 transport protocol, the source address is found in the transport protocol CAN IDs (see also the DM1 trace examples later).
DM1 transmission rate
By default, DM1 is broadcast every 1 second (1 Hz) as well as on state change (i.e. when a DTC becomes active/inactive). This contrasts with all other diagnostic messages (DM2-DM60), which are all available only on-request.
Sometimes DTC related to specific SPNs may intermittently switch state at high frequency. In such a case, the J1939-73 document details more specific rules on the transmission rate as illustrated. This serves to avoid an excessively high rate of DM1 messages being broadcast.
For example, in example 1 a fault arises intermittently within a single second period with multiple state changes. However, only the first state change triggers an additional DM1 to be broadcast.
In example 2, an extra DM1 is broadcast on both the state change from inactive to active, as well as from active to inactive - as these arise in separate 1-second periods.
Example 3 shows the same points, but in a case where one DTC is already active and a second becomes intermittently active.


DM1 signal encoding
In the illustration we display the DM1 signal encoding.
Notice how we split the encoding into the DM1 'header' (lamp status), the 1st DTC and the 2nd DTC. If 0-1 DTCs are active, the data fits in a single CAN frame and the remaining 2 bytes are padded. When 2+ DTCs are active, the DM1 payload is extended with the relevant signals for each DTC (illustrated by DTC #2).
As a result, DM1 does not have a fixed data length like most J1939 PGNs - but rather a variable one. This introduces decoding complexity as the message is broadcast as a single-frame message when 0-1 DTCs are active, but as a multi-frame message when 2+ DTCs are active. More on this later.
Below we illustrate the DM1 message frame encoding for the case of 0-1 active DTCs (ignoring the two filler bytes at the end). Next, we will further detail the lamp status and DTC sections.

DM1 lamp status/flash signals
The initial 2 bytes of DM1 reflect lamp-related signals. These are not DTC specific and hence not repeated with each active DTC. Instead, they can be thought of as a 'header' section in the DM1.
Below we briefly outline how each lamp status signal is to be interpreted. Each lamp status signal is a 2 bit value where a value of 0 means off and 1 means on. The values 2-3 are reserved. Normally, when one of the lamp status signals equal 1, DM1 contains an active DTC that explains the lamp status.


Protect Lamp
(SPN 987)
Active DTCs relate to the vehicle system, but not related to the electronic sub system

Amber Warning Lamp
(SPN 624)
Active DTCs relate to the vehicle system, but do not warrant stopping the vehicle

Red Stop Lamp
(SPN 623)
Active DTCs are critical enough that the vehicle should be stopped immediately
Malfunction Indicator Lamp (SPN 1213)
This is used only when at least one of the active DTCs are emissions-related

In practice, a single ECU in the J1939 network will control the actual physical warning lamps in the vehicle and decide how to illuminate these based on the DM1 lamp statuses communicated across all of the ECUs on the network. Here, the 'flash' signals for each of the four lamps come into play as shown in the table as they toggle the way the physical lamp is illuminated.
A flash signal value of 0 indicates slow flashing (1 Hz), a value of 1 indicates fast flashing (2 Hz), while the values 2-3 are reserved/unavailable. When multiple ECUs communicate different statuses, illumination is based on the worst case.
Below we show examples of DM1 lamp-related signals across different vehicles:

As evident from the table, when there are no active DTCs (i.e. FMI = 0 for the 1st DTC) for a given ECU, the values of the lamp status signals may either be set to 0 (i.e. off) or 3 (i.e. not available) in what seems to be an arbitrary fashion - even for ECUs in the same vehicle. See e.g. Bus-Diesel-1.MF4, where there are no active DTCs for source address 0x00 and 0x03 - but the PL status is set to 3 for 0x00 and 0 for 0x03.
Another observation is that there can be cases where a DTC is active (i.e. FMI > 0 for the 1st DTC), yet no lamp status signals take the value 1. This is e.g. the case for Loader-JCB.MF4 SA 0xE4, which may be attributed to the fact that the active DTC is proprietary and the FMI is 31 (which can reflect a non-standard FMI). Given the non-standard nature of this DTC, it may therefore be an implementation decision by the OEM to not risk triggering the illumination of a dashboard lamp. Another example is Truck-Freightliner.MF4 SA 0x21, where there is an active DTC with FMI = 4 (and OC 126, although not evident from the table). The active DTC SPN in this case is 6893 (PEMS Engine Fuel Mass Flow Rate) and the FMI means 'Voltage Below Normal, or Shorted to Low Source'. It may be that this is considered a sufficiently non-critical DTC, implying that none of the lamp status signals are set to 1.
DM1 Diagnostic Trouble Code (DTC)
After the initial lamp-related signals, the rest of DM1 consists of diagnostic trouble codes (DTCs). Each DTC consists of four parts as explained below. Note that when no DTCs are active, all bits of the 1st DTC equal 0.


1: SPN (Suspect Parameter Number)
The SPN signal is a 19-bit number that helps identify the specific sub-system that exhibits problematic behavior or has failed entirely. As explained in our intro to J1939, each parameter aka signal in a J1939 network is assigned a specific SPN value. Standardized SPNs can be looked up in the J1939-71 standard (e.g. via the J1939 Digital Annex or J1939 DBC file). These fall in the range of 1 to 24324 (as of J1939 DA 2025 Q1). In contrast, proprietary SPNs will be known only to the manufacturer and will fall in the range 516096 to 524287. In the table we show examples of actual SPNs communicated via DM1 DTCs across 10+ vehicles.
As a bit of a technicality, the SPN is encoded in a way that makes it impossible to extract the full 19 bit value using standard DBC file syntax. As a result, the SPN signal is composed of two separate parts as per our DM1 breakdown, a 16-bit SPN Low (also sometimes named just SPN) and 3-bit SPN High. Typically, the latter is defined with a factor of 65536, which enables software/API tools to sum the decoded values of these two components to get the final SPN.

2: FMI (Failure Mode Identifier)
The 5-bit FMI indicates what type of failure is detected for the specific sub-system identified by the SPN. The table shows how the FMI values are to be interpreted. The J1939-73 document Appendix A provides further details on each of the FMI codes.
Many of the FMIs reflect situations where a signal value is outside a pre-defined expected threshold - e.g. FMI 0 'Data Valid But Above Normal Operational Range - Most Severe Level' or FMI 5 'Current Below Normal or Open Circuit'.
When proprietary SPNs are seen in DTCs, FMI 31 is often used as a way of communicating a non-standard failure mode.

3: CM (SPN Conversion Method)
The 1-bit CM signal will normally be equal to 0, implying that the SPN is encoded as described above (i.e. as per J1939-73 2022). This encoding is also referred to as 'Version 4' and has been mandated since 1996. Across use cases, we normally see less than 5% of heavy-duty vehicles with a DM1 CM value of 1, in which case the SPN is encoded using one of the three earlier versions.

4: OC (Occurrence Count)
The 7-bit OC signal specifies how many times a specific fault has been detected. It is incremented by one every time the DTC changes state from inactive to active, up to a max of 126 (where it remains until cleared). The max value 127 is interpreted as the OC not being available.
Below we show real-life DTC signal values across various heavy-duty vehicles:

DM1 example CAN bus traces
As explained, the decoding of DM1 is a bit more complex than most J1939 PGNs due to the variable length. In this section we therefore illustrate real-life raw CAN bus traces showing different scenarios.
Example 1: Single-frame J1939-73 DM1 (0 active DTCs)
In this example, DM1 is communicated as a single CAN frame with a payload of 8 bytes. Notice how the warning lamp bits all equal 0, the flash signal bits all equal 1 and the DTC signals all equal 0 - consistent with a scenario with no active DTCs.

Example 2: Single-frame J1939-73 DM1 (1 active DTC)
Here, an ECU initially has 0 active DTCs until a single DTC becomes active (SPN 2791). Notice that the lamp flash signal bits again all equal 1 both before/after the DTC. The lamp status signals initially equal 0xC3 (0b11000011), meaning all are 'off' (0b00) or undefined (0b11). When the DTC is active, the byte changes to 0xC7 (0b11000111) meaning that the Amber Warning Lamp (AWL) is now 'on'.

Example 3: Multi-frame J1939-73 DM1 (3 active DTCs)
In this example a total of 3 DTCs are active, meaning multi-frame communication is necessary via the J1939 transport protocol. To enable proper decoding of DM1 we must first re-assemble the frame. Notice how we know the DM1 source address 0x0B from the TP.CM/TP.DT CAN IDs. After assembly we can apply the signal decoding as described previously. Note how the DTC signal decoding rules are simply repeated for each additional DTC in the payload.

Other Diagnostic Messages (DM2, ..., DM60)
We focus on DM1 in this article as it is the most relevant for J1939 data logging/telematics:
- It provides details on what failed (SPN), how (FMI) and how critical it is (lamps)
- It is broadcast, meaning no requests are required (enabling silent logging)
However, the J1939-73 document also details several other diagnostic messages. Below we detail a few examples of other DMs.
All DMs other than DM1 are available only on-request. Requests can be made via the J1939 PGN 'RQST' as described in our intro to J1939. A request can be global (targeting all ECUs) or destination-specific (targeting a specific ECU). In the latter case, the ECU must respond with a 'negative acknowledgement' message if it is unable to perform the requested action. This is done using the PGN 59392 with the control byte set to 1, as per J1939-21.
DM2 is structured exactly like DM1, but lists all previously active DTCs (since the last clearing event). The lamp signals should reflect the current status of the ECU. This makes DM2 a useful supplement to DM1 for historical insight into periods where no data logging was available.
If DM3 is supported and a diagnostic tool requests this PGN, it will result in erasure of all information related to previously active DTCs - effectively clearing the contents of DM2. This is normally done with the vehicle ignition on and the engine off - but may in some cases be possible with the engine on. Note that emissions regulation may prohibit support for DM3 and only allow DM11 to be used.
This is similar to DM3, but targeting active DTCs. DM11 allows technicians to clear active DTCs e.g. after resolving an issue. The actual clearing may take up to 5 seconds. For J1939 networks that are OBD-regulated, the use of DM11 clears all diagnostic information - including both active and previously active DTCs, freeze frames, counters and more. Further, it is only allowed to use DM11 via a global request (i.e. clearing all ECUs), whereas a destination-specific request is not allowed (and ECUs should respond with a 'not acknowledged' message).
How to log & decode J1939-73 DM1 data
For general details on how to log/decode J1939 data, see our intro to J1939 and intro to J1939 data logging.
As explained in those articles, we recommend using a CANedge CAN bus data logger and a suitable adapter (e.g. DB9-J1939) to connect to the J1939 network in your vehicle.
By doing so, the device will auto-detect the bit-rate and start recording the raw J1939 data into log files on the SD card. If you use a CANedge2/CANedge3, the log files can optionally be offloaded to your own server via WiFi/LTE.
If you instead need to stream J1939 data in real-time, you can use the CANsub.2/CANsub.4 to stream the data via USB or Ethernet into webCAN, which automatically reassembles multi-packet J1939 TP messages (incl. DM1).
The raw J1939 data (excl. DM1) can be decoded via our J1939 DBC and visualized in free software/API tools.


To DBC decode and visualize J1939-73 DM1 data and extract active Diagnostic Trouble Codes (DTCs) you should use our MF4 decoders and J1939-73 DBC. The MF4 decoders and webCAN natively support the J1939 transport protocol, meaning they will seamlessly decode e.g. all your DM1 data, regardless of the number of active DTCs.
Our J1939-73 DBC files separate the DM1 into the lamp signals (header) and separate DTCs. When using the MF4 decoders, this produces separate folders/tables per DTC, header and source address. As illustrated, this can result in a large number of separate tables - which can make it tricky to summarize results.
To solve this, our plug & play automation workflows create a 'combined' table across DTCs and source addresses (adding the source address in the table as a separate column). The resulting Parquet files will look as illustrated. Notice how the table also includes a calculated SPN that sums the two sub components (i.e. the SPN Low and SPN High in the example). This is particularly important for Original Equipment Manufacturers (OEMs) who often focus on DTCs that include proprietary SPNs.
Solution example 1: J1939-73 CANedge telematics

J1939 DM1 Grafana dashboard
If you record raw J1939 data with the CANedge, you can of course process the data offline incl. the outlined DM1 decoding - e.g. outputting local Parquet/CSV files.
However, you can also automate the process by deploying one of our plug & play automation workflows. For example, if you deploy a CANedge2/CANedge3 to upload raw J1939 data to your own AWS S3 bucket, you can set up our Grafana-Athena workflow. This enables automatic DBC decoding via AWS Lambda functions (with DM1 decoding support) - creating a Parquet data lake that can be visualized in Grafana dashboards. To see this in action, check out our J1939-73 dashboard playground. You can set up similar workflows in Google/Azure.
Note how the DTC overview table leverages the 'calculated' table described in the previous section to enable a clean overview.
J1939-73 Grafana dashboard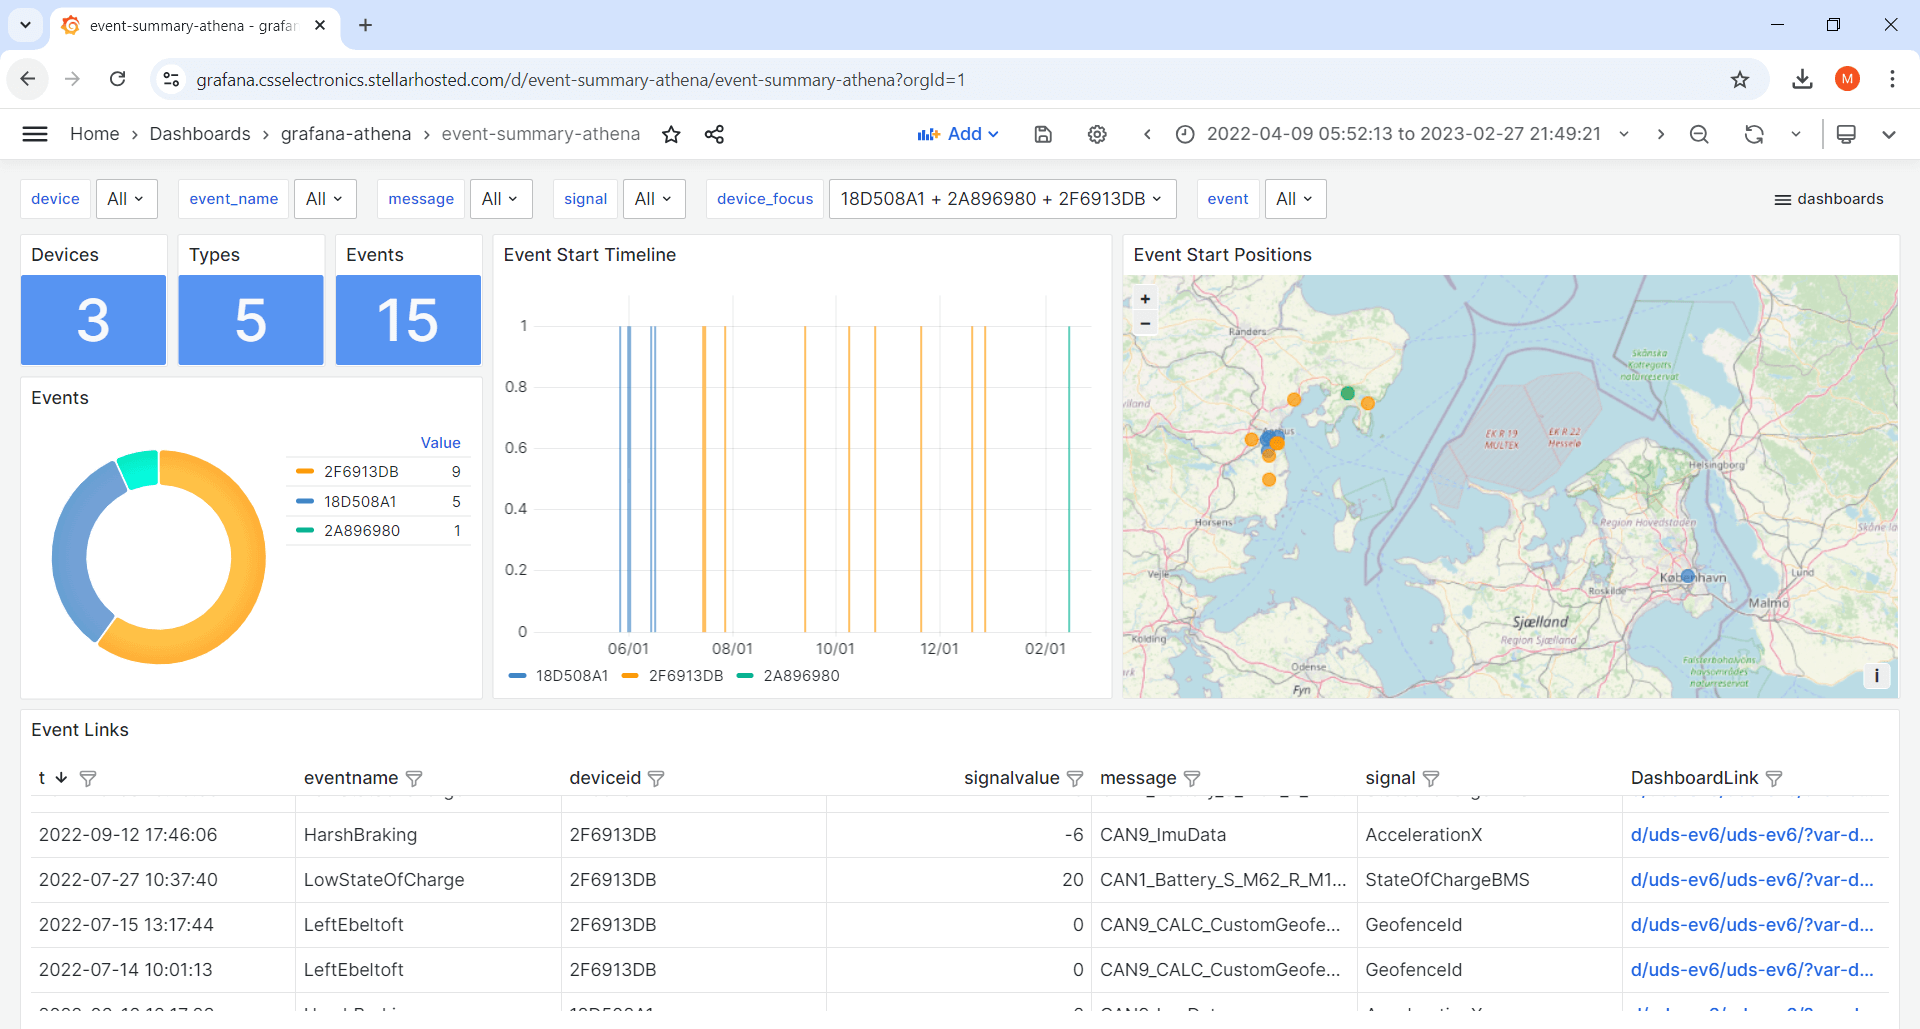 Grafana-Athena can visualize historical events across all devices
DTC event-detection + visualization
If you want to go beyond the basics, you can also deploy automated event detection.
Once you have deployed the basic Grafana-Athena integration you can easily extend it to also detect custom signal events. We provide plug & play examples for the case where DM1 DTCs become active. Every time a CANedge log file is uploaded to S3, the Lambda function automatically checks for such events - and optionally notifies relevant subscribers by email/SMS if a DTC becomes active. This is by default evaluated based on whether the DTC #1 Occurrence Count (OC) value increases beyond 0.
This workflow also allows you to visualize all historical events via an event summary dashboard - letting you quickly browse historical DTC events and zoom in on the surrounding data. To learn more, see our event detection article.
dashboard playground event detection introSolution example 2: J1939 TP & DM1 real-time analysis in webCAN
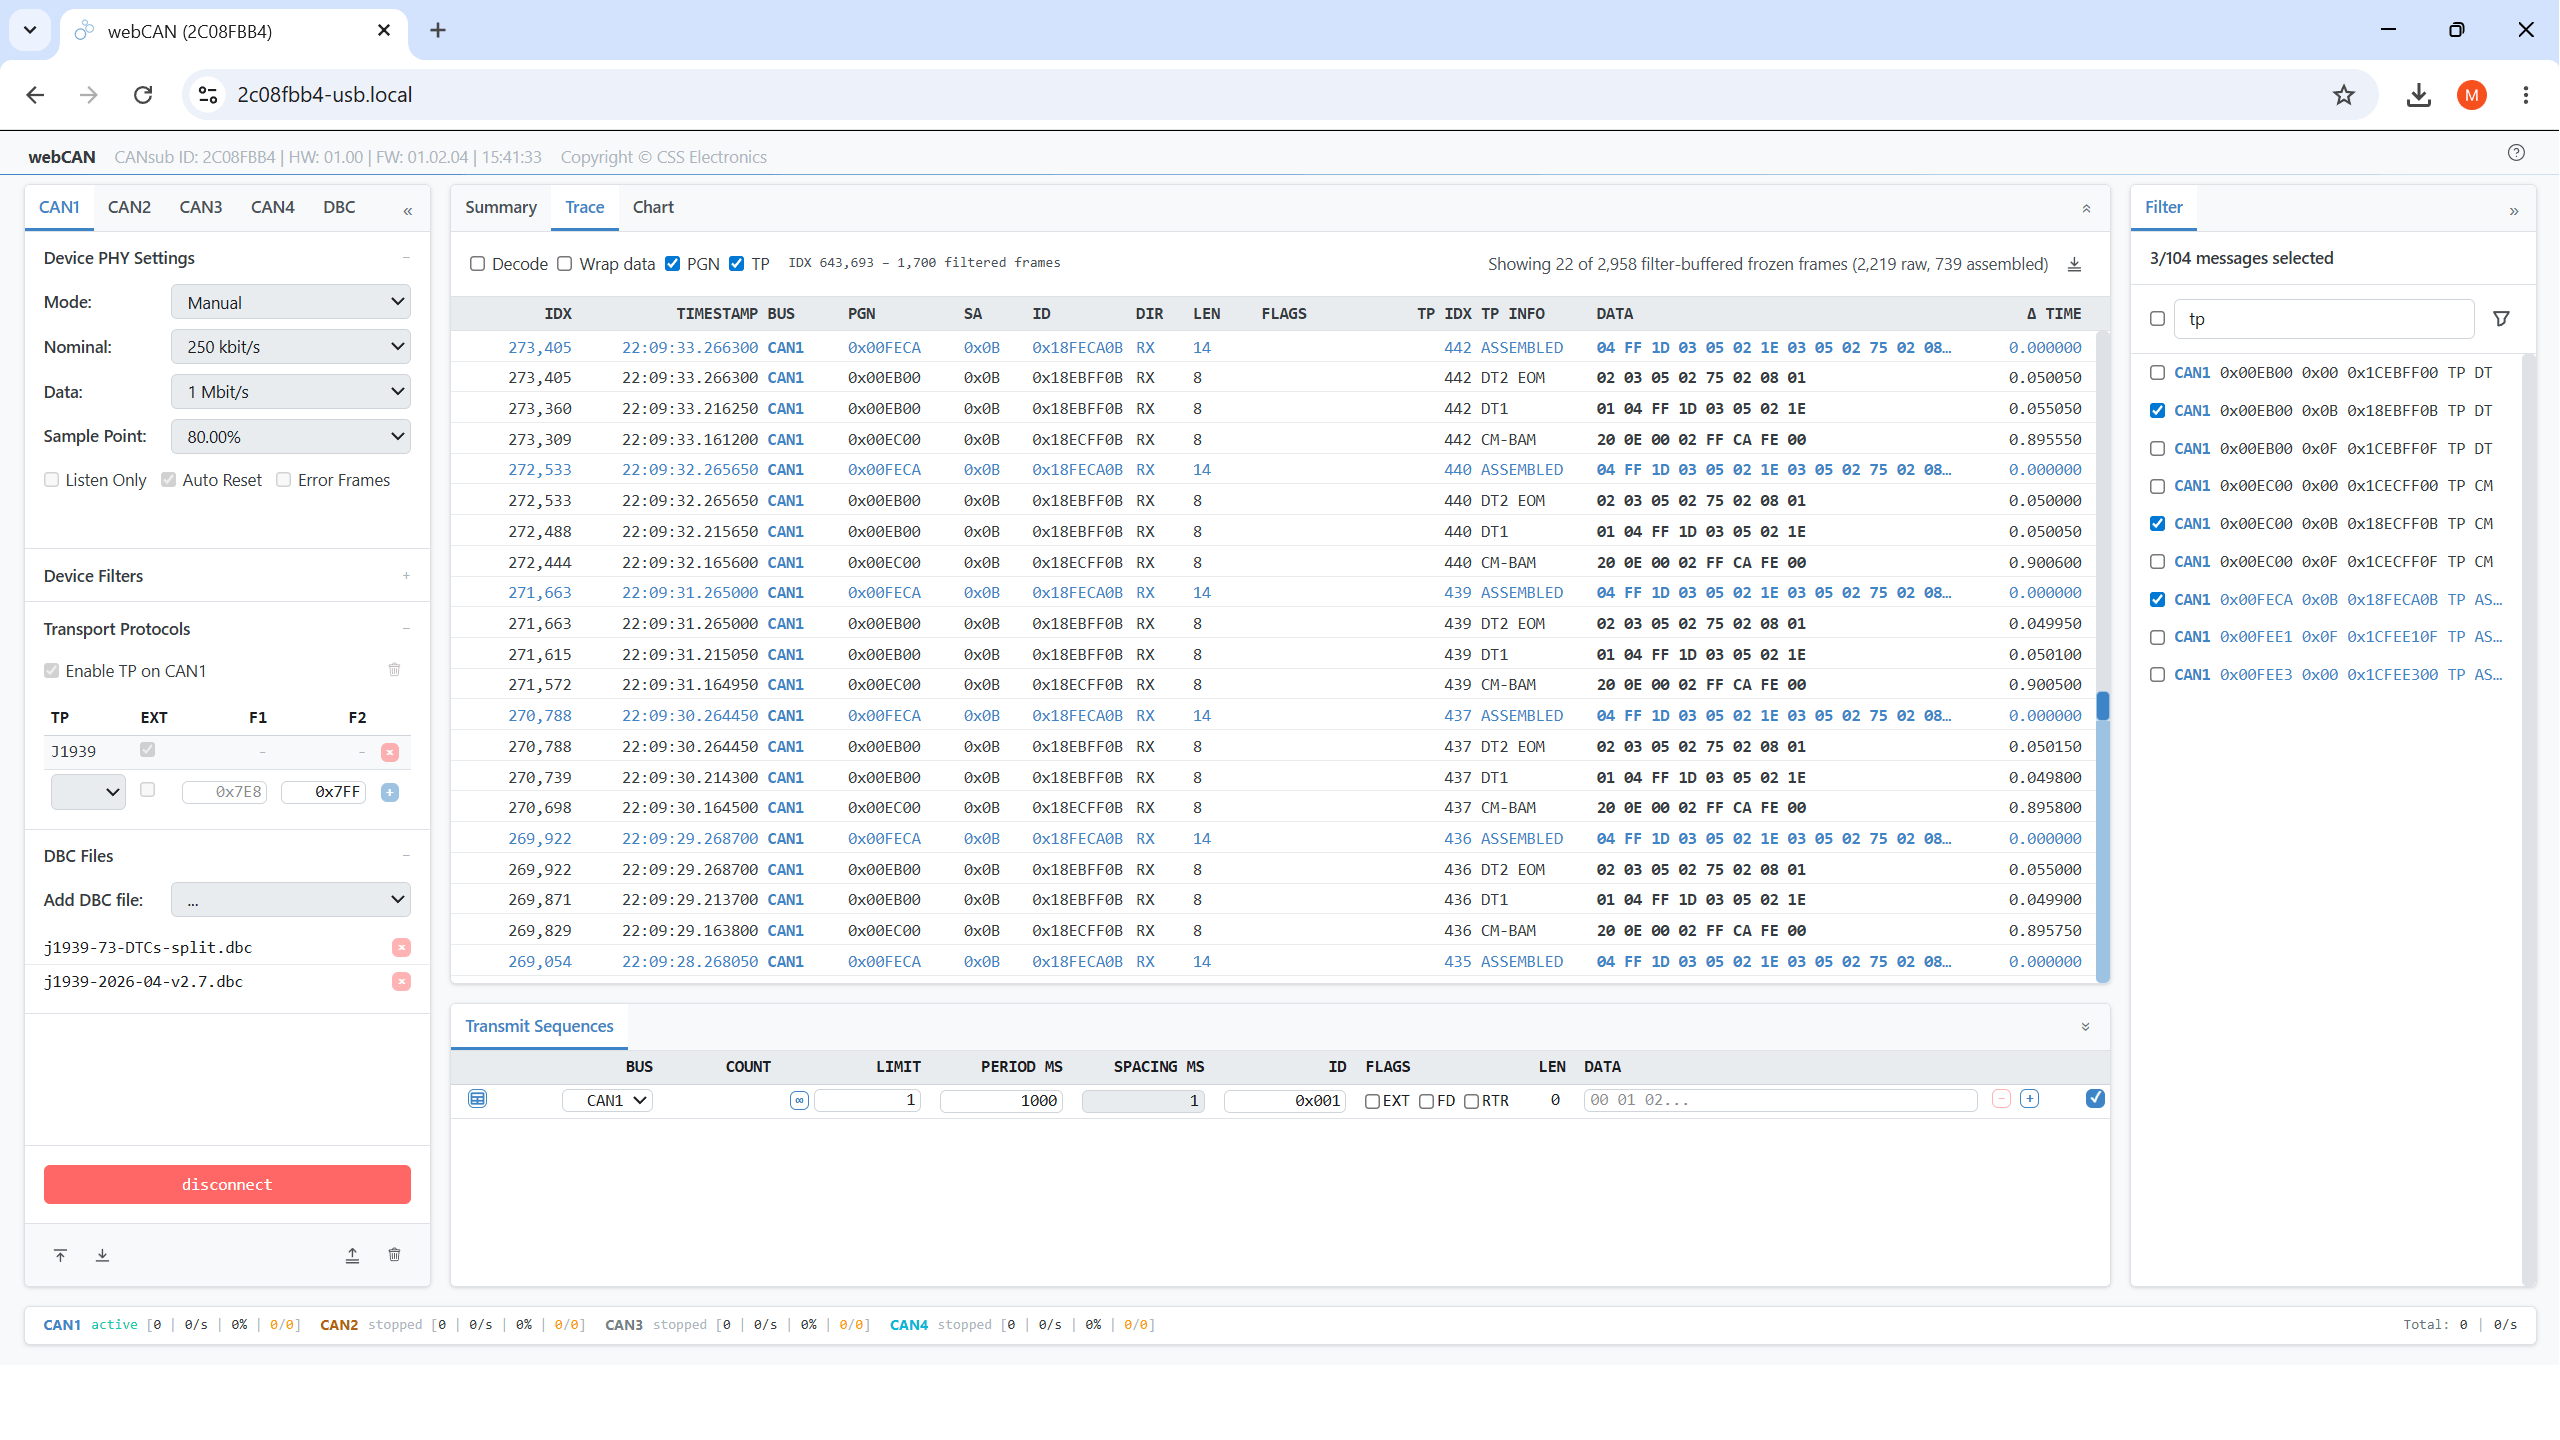
For live diagnostics, you can stream J1939 data directly from the vehicle into your browser using a CANsub.2/CANsub.4 and our free webCAN software - no installation required.
With J1939 TP enabled, webCAN automatically detects BAM and CM/CTS sessions and reassembles the multi-packet payloads into single logical frames tagged by their PGN. This is critical for DM1, which is variable in length: when no DTCs are active it fits in a single 8-byte CAN frame, but as soon as one or more DTCs become active the message grows beyond 8 bytes and is transmitted across multiple TP packets. webCAN transparently handles both cases - so the same DM1 row in the GUI always shows the full, current set of active DTCs.
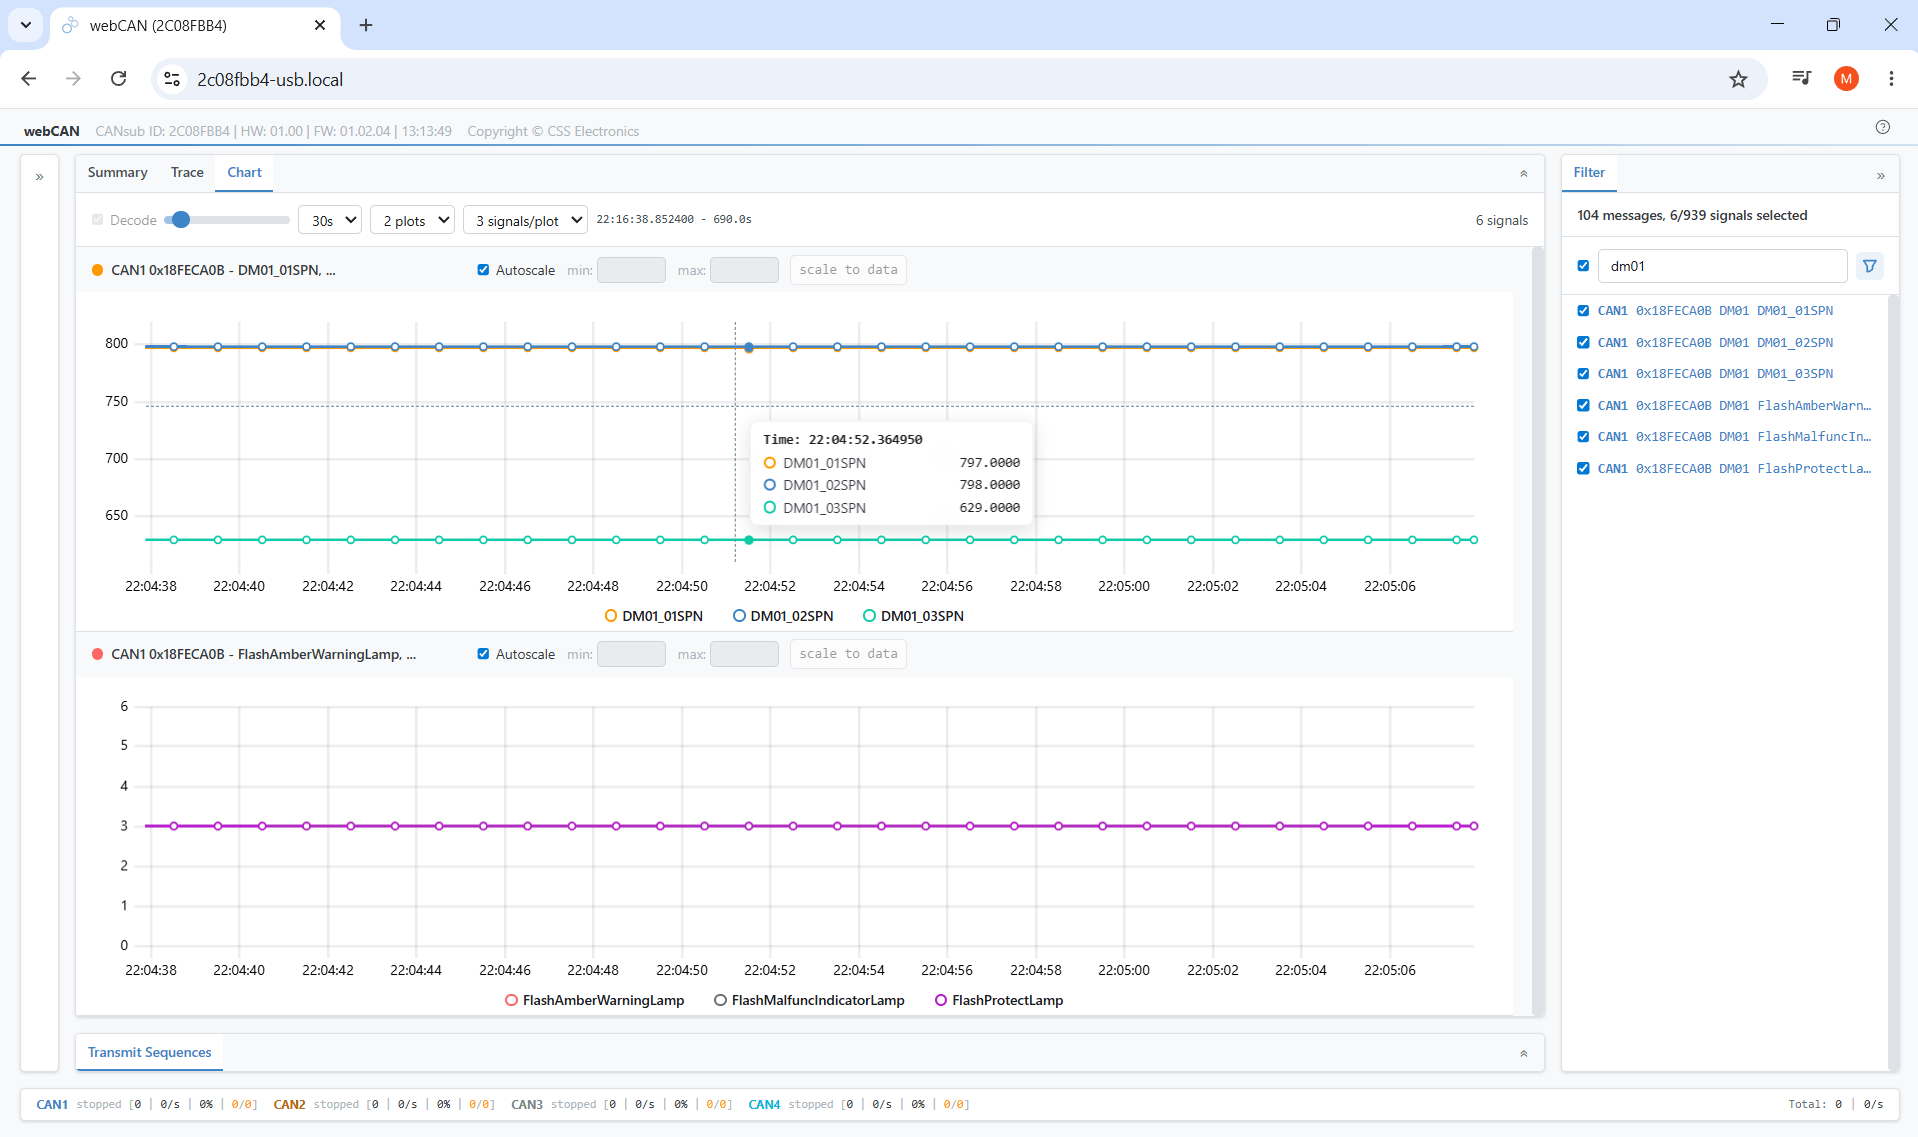
Loading the J1939-73 DBC (and the J1939 DBC for SPN name mapping) then DBC decodes the assembled DM1 frame on the fly into named signals - SPN, FMI, OC and lamp statuses - viewable live in webCAN's signal view for in-field troubleshooting.
CANsub.2 CANsub.4 webCAN softwareJ1939-73 DBC file
At CSS Electronics, we collaborate with SAE to transform the J1939-73 PDF document into a J1939-73 DBC file with 50+ Diagnostic Messages (DM1, DM2, DM3, ...).
In particular, the DBC includes specialized DM1 DBC files that enable plug & play DBC decoding using our CANedge MF4 decoders - for visualization in Grafana dashboards and/or analysis in Python/MATLAB. It also includes the various DMs in DBC file formats suitable for use in the CANsub webCAN GUI as well as 3rd party tools.
We also recommend getting our J1939 DBC as this lets you decode non-diagnostic J1939 PGNs. In addition, the J1939 DBC comes with 'SPN mapping tables' that enable you to map DTC-extracted SPN IDs to their SPN names.
j1939-73 dbc j1939 dbc
Use cases
Set up predictive maintenance across heavy-duty fleet
Want to be notified about active DTCs across your vehicle fleet?
You can deploy the CANedge2/CANedge3 across a fleet of heavy-duty vehicles to collect data to your own AWS S3 bucket, automatically DBC decode it and visualize it in telematics dashboards using Grafana-Athena - incl. DM1 DTC overview tables. By extending this with the alert functionality, you can easily be notified when new DM1 DTCs become active. Through the AWS SNS topic functionality, you can add/remove subscribers and select the notification method (email, SMS, ...).


Super charge your J1939 diagnostics at scale
Need to drastically speed up your troubleshooting and diagnostics?
A common use case for the CANedge is to collect data across a fleet of prototype trucks/buses/tractors for analysis by OEM engineers. The goal may be to capture intermittent events for diagnostic purposes and troubleshooting. This is often done based on ad hoc feedback from the field. However, by enabling DM1 decoding and DTC detection in your Lambda, you can immediately spot events of interest based on when J1939 DM1 DTCs became active. Using the event dashboard you can click specific DTCs of interest via built-in links to 'zoom in' and analyze your full-resolution J1939 data surrounding the DTC activation time. This can be combined with trip summary aggregation, enabling you to e.g. perform aggregate analysis on trips with active DTCs.
Diagnose your J1939 equipment via Python/MATLAB
Need to perform advanced statistical J1939 diagnostics?
As an OEM you may need to diagnose the root cause behind various intermittent J1939 DM1 diagnostic trouble codes using statistical methods. For this purpose, you can deploy a large number of CANedge1 units across a late-stage prototype vehicle fleet to collect GBs or TBs of data for further analysis. The MF4 decoders can be used to easily create a local Parquet data lake incl. DM1 decoding. In turn this lets you quickly deploy powerful analyses via MATLAB or Python as both include powerful support for Parquet data lakes. OEMs can also deploy the CANedge + CANmod.router to collect 5 x CAN in parallel and seamlessly decode via the same process, retaining full tracability of any DTCs across CAN buses and source addresses.


Run wireless DM1 diagnostics on in-field heavy-duty vehicles
Need to troubleshoot active J1939 DTCs on a heavy-duty vehicle in the field
Connect the CANsub.2/CANsub.4 via Ethernet to a WiFi router on e.g. trucks, buses or tractors. Field technicians with WiFi access can now open webCAN wirelessly in their browser - with no installation. Use periodic transmit sequences to send extensive J1939 diagnostic request sequences (e.g. for DM1, DM2 or freeze-frame data) with 10 µs scheduling on the device itself for rapid in-field troubleshooting. Save the full setup as JSON and reload on demand to repeat the same diagnostic playbook. webCAN automatically reassembles J1939 TP multi-packet messages and DBC decodes the data via the J1939 DBC/J1939-73 DBC - critical for displaying active DM1 DTCs in real-time.
Ready to deploy J1939 diagnostics?
Get your CANedge today!


