Grafana Assistant AI + CAN Bus [Data Lakes & Dashboards]

Need to analyse/visualize gigabytes of CAN bus data in seconds?
In this intro you'll learn how to use Grafana Assistant, the new LLM (Large Language Model) integration for Grafana. This tool lets you use AI to extract insights from your vehicle/machinery data - and create custom Grafana dashboards 10x faster.
We'll get practical with 3 'get started' tips and 7 awesome show cases of using Grafana Assistant to step change your data analysis and visualization!
Update: Grafana Assistant now supports both BigQuery and Athena!
In this article

We'll provide multiple cool showcases of Grafana Assistant in action!
Why use Grafana Assistant for your CAN data analyses?
Our end users face a challenge:
They can collect tons of CAN/LIN data using the CANedge - but now have to explore/visualize data across several devices, thousands of log files and months/years of data.
Most of our users are engineers, but not data scientists. And even if they are, statistical data analysis/visualization can be extremely time consuming.

12 showcases: Examples of analysis outputs from our ChatGPT article
Why not use ChatGPT?
One solution to this can be to use ChatGPT to help analyze the data - which we wrote about in our 2023 ChatGPT article. However, ChatGPT has some practical limitations:
-
Limited to manually uploading small files (e.g. 100 MB CSV)
-
Analysis results are not easy to share
-
Outputs are 'static' (e.g. Python-generated plots)
To an extent, the above challenges can be resolved in modern chatbots like ChatGPT and Claude through the use of MCP (Model Context Protocol) servers. MCP is essentially like an API interface for LLMs, enabling them to leverage various 3rd party tools in a systematic way. This is essentially also what is being used under-the-hood in the Grafana Assistant integration.
However, setting up custom MCP integrations in e.g. ChatGPT or Claude is non-trivial and not in practice feasible for most of our end users - whereas Grafana Assistant requires zero setup once users have deployed on of our plug & play Grafana dashboard integrations.
Grafana dashboard integrations
In practice, our end users typically collect GBs (or TBs) of data to their own Amazon, Google or Azure cloud server using the CANedge2 (with WiFi) or CANedge3 (with LTE).
Further, most users deploy our plug & play Grafana dashboard integrations. These integrations automatically DBC decode uploaded log files - creating Parquet data lakes that contain time series data like speed, temperatures, DTCs and more. These data lakes can then be queried via 'interfaces' like Athena (Amazon), BigQuery (Google) or Synapse (Azure) - enabling tools like Grafana to easily visualize the data via SQL queries.
Users can easily deploy our plug & play dashboard templates without any Grafana/SQL expertise. However, creating more advanced dashboards and complex queries can be a challenge for non-technical users - and time consuming for anyone.


Grafana Assistant key features
With the new assistant, Grafana enables seamless LLM access to existing data sources that are already set up within Grafana. This adds multiple powerful features:
-
Zero setup: If you have already deployed our Grafana integration, no setup is required - you can start prompting your data lake immediately
-
Analyze TBs of data: Unlike ChatGPT, you do not have to limit your analysis to e.g. 100 MB of data - the assistant can query your entire data lake out-the-box
-
Data exploration: You can now simply chat your way to powerful data insights and through complex diagnostic analyses - zero query or coding knowledge required
-
Dashboard creation: The assistant can create fully customized Grafana dashboards in seconds based on high level prompts - drastically reducing time spent
-
Retain & share insights: Any data insights can be easily summarized into Grafana dashboards, enabling you to navigate the data temporally and share it with your team
It's basically Cursor/Windsurf for your dashboards and data lake.
How to get started?
In the following we assume that you have already set up your Grafana dashboard integration for your specific cloud (Amazon, Google or Azure). You can find details on this in the CANedge Intro.
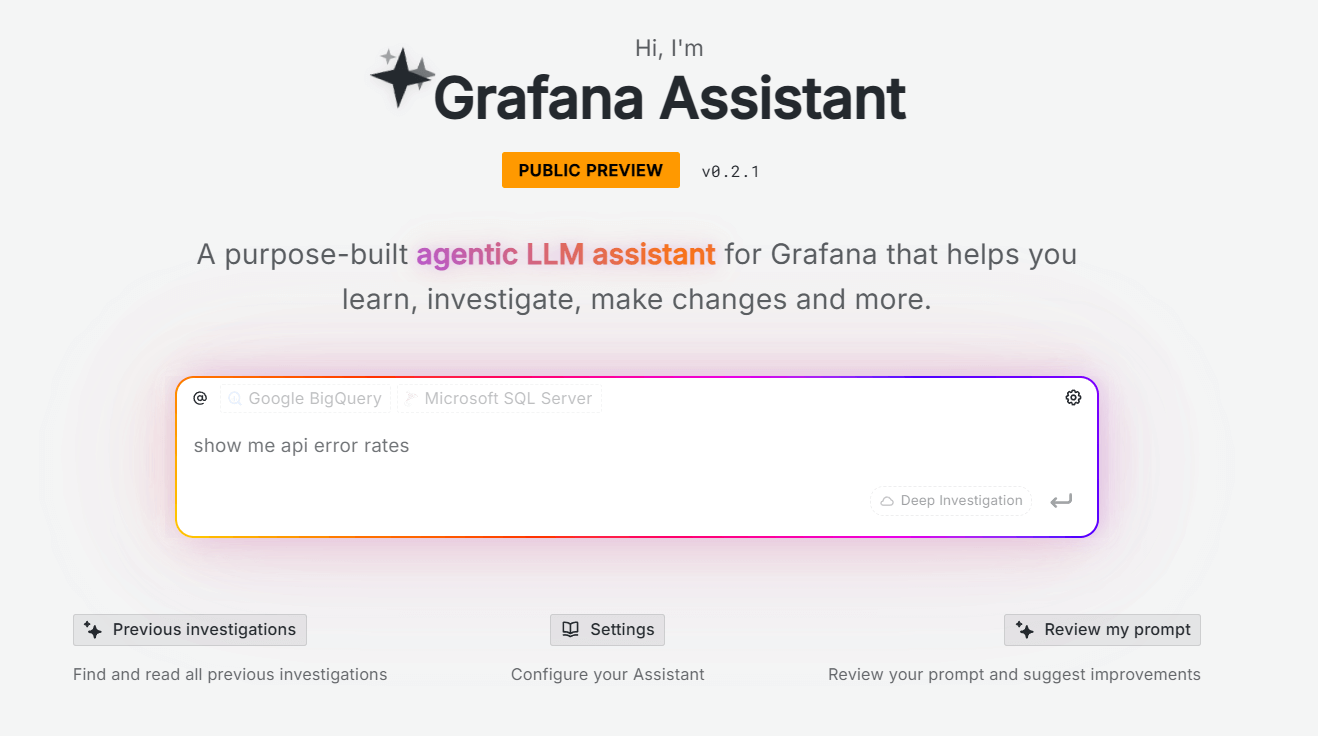
To start chatting with Grafana Assistant, you can open the chat window via the left-menu Assistant tab. Alternatively, you can open the chat panel within a dashboard via the icon in the upper right corner.
To get the best experience, we recommend to follow below steps:
1: Use 'dynamic dashboard' as basis
When using the assistant we always recommend using our 'dynamic' Grafana dashboard template as the starting point. You can easily download this from the CANedge Intro and import it in Grafana. The template serves as a strong foundation because it enables dynamic interaction with the data via pre-defined Grafana Variables, allowing users to e.g. dynamically switch between all the CANedge devices that are in the data lake. It also provides the assistant with a starting point for creating custom dashboards or storing exploration insights as panels.
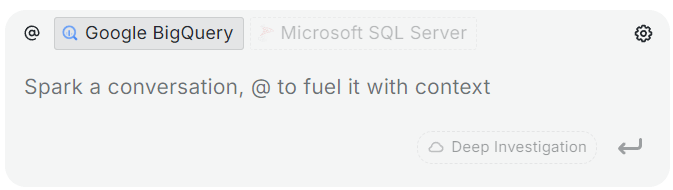
2: Select data source as context
In the chat window, you can specify the relevant data source as context. While not strictly required, it allows the LLM to skip the step of identifying the data source.
3: Paste 'system prompt'
Providing a good 'system prompt' to the assistant is critical.
In our showcase examples, we start every new conversation with our 'system prompt', which we iterated on through hours of testing. This has a dramatic impact on the reliability and consistency of the LLM responses.
As Grafana Assistant develops, we expect to provide updated system prompts for each of our Grafana dashboard integrations.
Grafana Assistant supports adding 'rules', similar to most LLMs. This is specifically designed to allow you to enter guidance (like the above) once and then have the LLM adhere to this in general whenever you chat with it. You can set rules via the small icon near the Grafana Assistant chat window. In our tests we typically added the guidance in-chat, mainly because we found the results to be slightly better vs. using rules - as if the LLM would assign a bigger weight to our guidance when provided in-chat. However, as LLM outputs are non-deterministic it is hard to say whether this is factual. We recommend that you do your own testing.
7 showcases of Grafana Assistant + CAN bus data
Now for the fun stuff: Let us visualize/analyze our 1 GB Kia EV6 dataset via Grafana Assistant!
For our tests we use CAN/UDS data from a Kia EV6 electric car. The data was recorded with a CANedge incl. GPS/IMU and includes information on the EV battery, temperatures, position, speed, acceleration and more (see the summary). The raw data and DBC files are available via our free EV data pack.
In our tests we use our Grafana-BigQuery integration which DBC decodes our raw CAN data to Parquet files, which are then stored in a Google Cloud bucket. This Parquet data lake can be queried via the Google BigQuery interface from Grafana. You can alternatively go through the same steps via our Grafana-Athena integration.
Note also that in each example we initially go through the 3 steps in our 'get started' guide above.

Ex #1: What data is available?
First we use the LLM to get an overview of our data lake.
This is a useful first step in exploring a CAN bus data lake as you do not necessarily have a clear overview of what devices, CAN messages and CAN signals are available. Further, constructing the SQL queries to extract this information is quite complex.
My data source contains data from a Kia EV6 electric car, recorded with a CANedge CAN bus data logger with device ID 2A896980. The data includes battery data from the EV and GPS/IMU data from a sensor module. I want to know the following:
1: What tables and columns are available for this device?
2: What time period does the data span?
As evident, Grafana Assistant starts analyzing the data via multiple queries, summarizing the results in a tabular form - and in the chat. Notice how the LLM iterates through multiple queries to understand the data structure. You can of course inspect what queries are used to generate each result, ensuring full transparency. The summary provides us with a good starting point for further investigation.
In our tests, we were at first enthusiastic about asking Grafana Assistant to always do the above query up front (e.g. as part of the system query), with the logic being that the LLM would now know all of our table/column names throughout the subsequent chat. However, in practice this was not the case at all as the LLM would make a lot of mistakes regarding table/column names that should have been avoidable if it had proper access to the previous outputs. This may be by design or due to the length of the table/column grid outputs (which can be hundreds of rows) and related to the known context-window limitations of LLMs.
In either case, we found that it was much better to assume that the LLM had very limited contextual recall ability about table/column names for chats that span multiple enquiries.
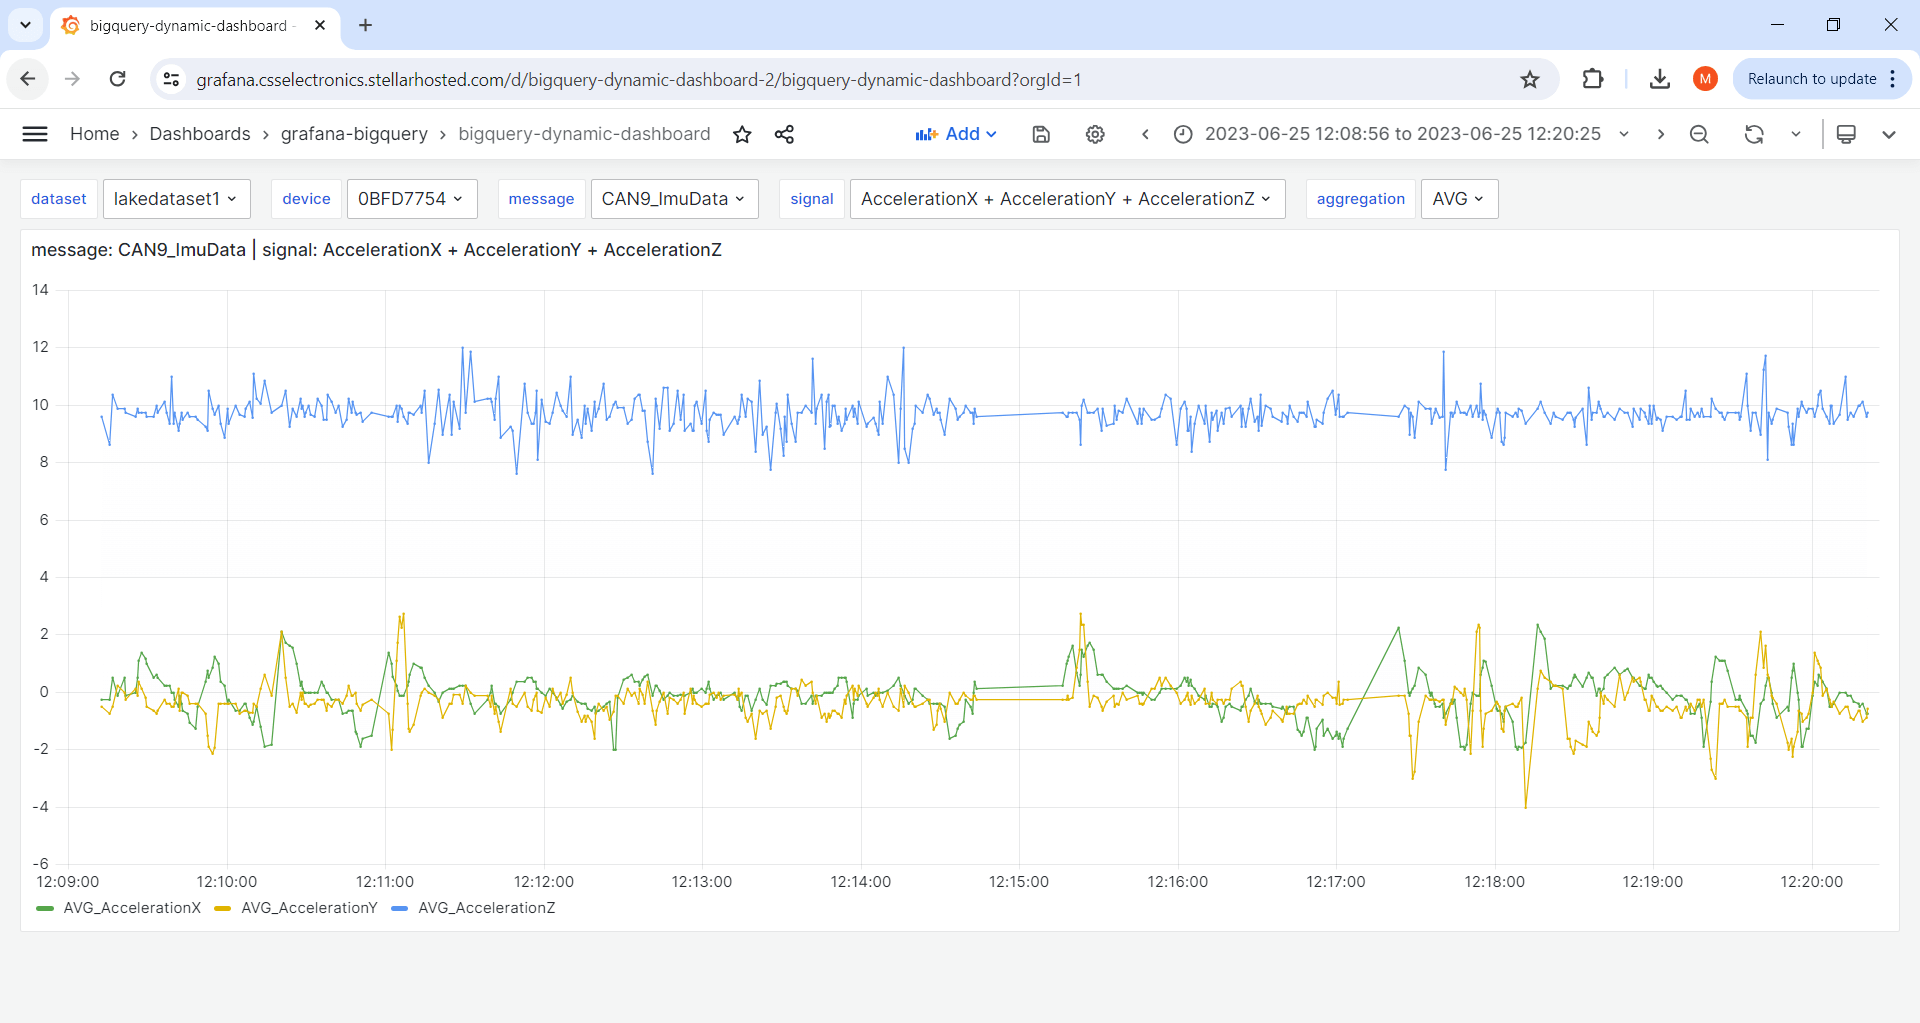
Ex #2: Explore CAN signals ad hoc
In many cases you'll want to explore the data directly in the chat window prior to creating actual panels.
Here, Grafana Assistant runs the relevant queries and produces the output in-chat as text or as plots. We can also prompt the LLM to create a panel that displays speed over time within our dashboard, which Grafana does successfully as shown below.
What is the average speed from the CAN2_GnssSpeed message in July 2023? It's in m/s
Please create a panel in this dashboard to visualize the average speed over time
It is a good idea to specify the unit of your signals when this is ambiguous, as is e.g. the case for the speed signal, as Grafana Assistant will otherwise simply guess.
Ex #3: Create dashboard (high level)
An obvious use case for Grafana Assistant is to create a new dashboard from scratch. In this example we try a minimal-effort prompt - leaving a lot up to the imagination of the LLM.
The result is a functional 12-panel dashboard where all SQL queries are as expected (i.e. as per our system prompt guidance). Notice in particular that the LLM proactively identifies available (and relevant) messages/signals. Pretty cool! It's worth reflecting on how commoditized LLMs + tools have already become - if this was 2022 we'd have been blown away.
However, the dashboard we get is highly inconsistent between re-runs of the same query. This is of course to be expected given the 'open ended' nature of our request. In our view, there's not much practical value to providing prompts that are this high level if the goal is to create real Grafana dashboards.
My data source contains data from a Kia EV6 electric car, recorded with a CANedge CAN bus data logger with device ID 2A896980. The data includes battery data from the EV and GPS/IMU data from a sensor module.
Update my dashboard to include panels showing my Kia EV6 battery data and GPS/IMU data.
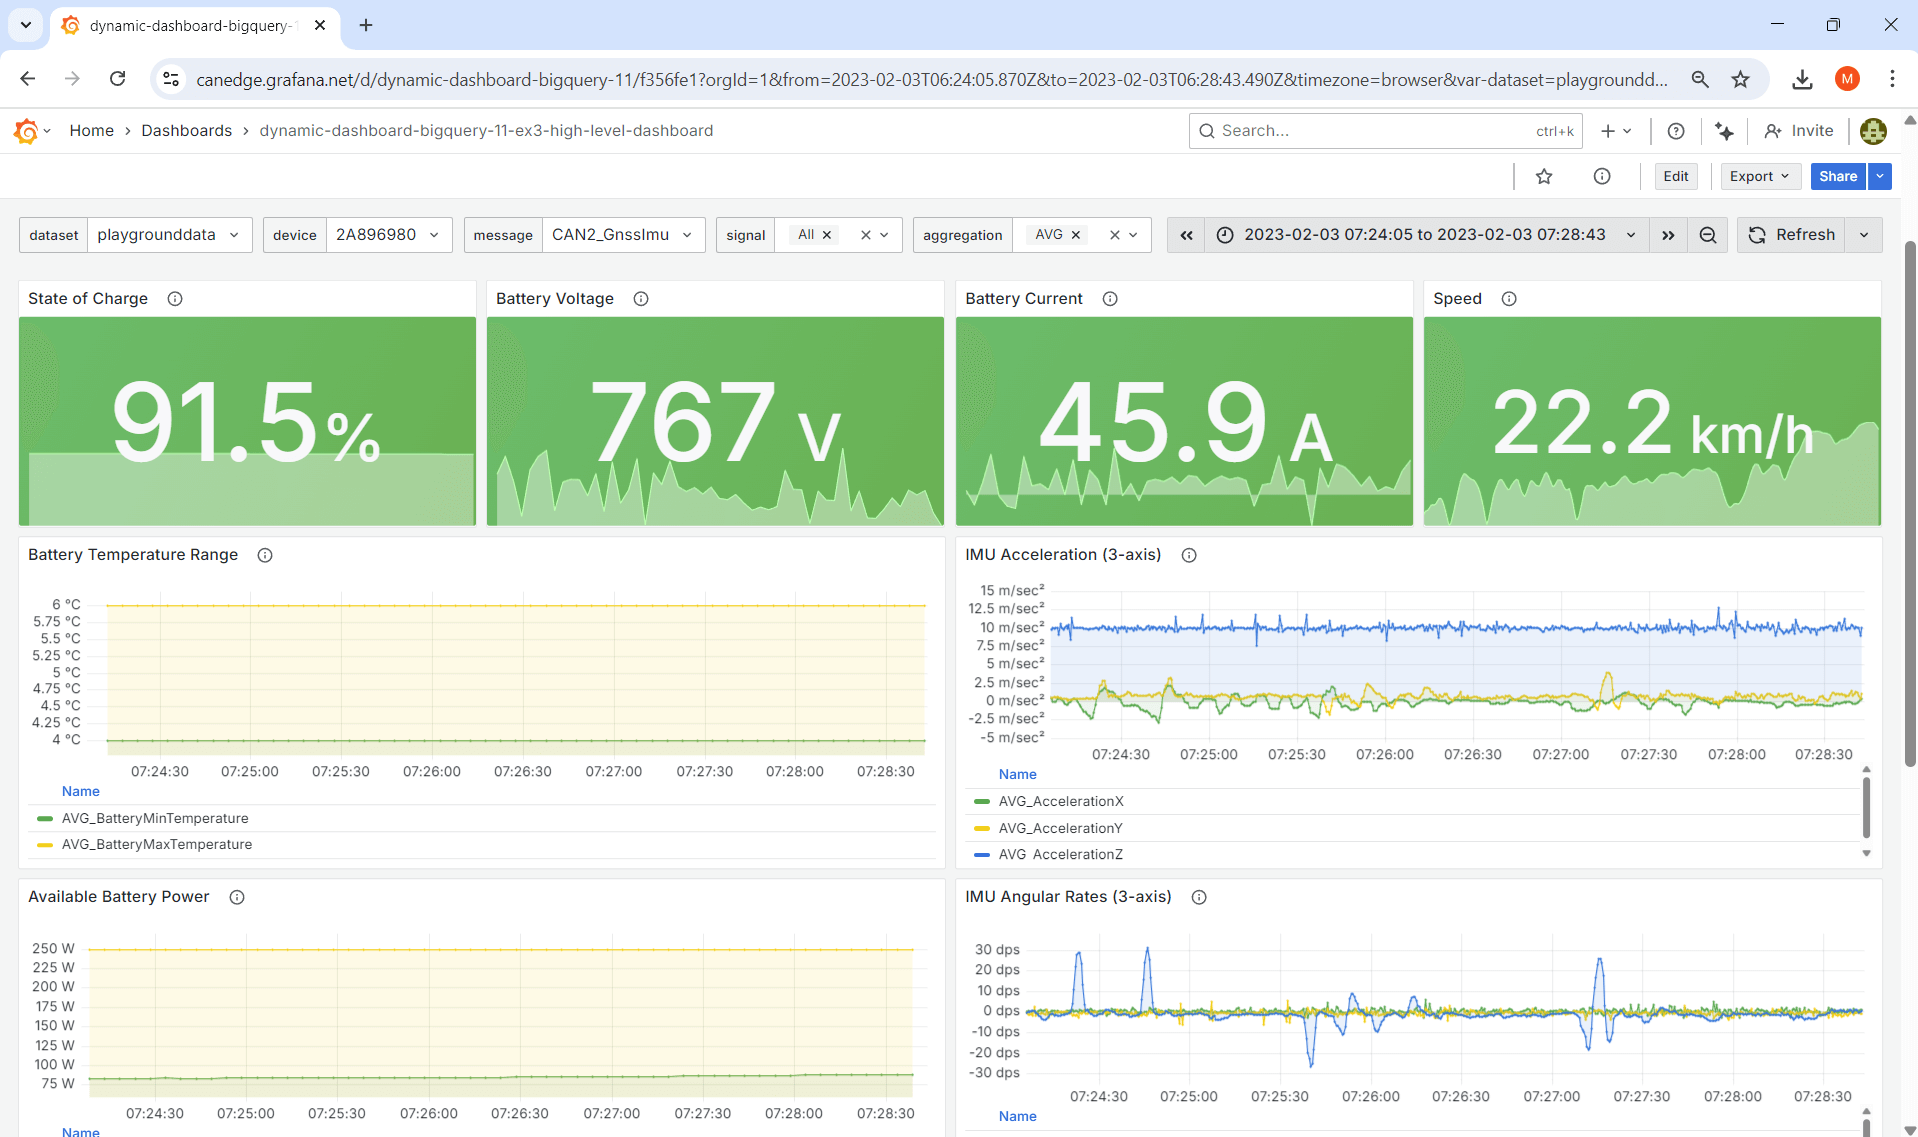 Result: Grafana Assistant spits out a decent 12-panel
dashboard
Result: Grafana Assistant spits out a decent 12-panel
dashboard
Ex #4: Create dashboard (detailed)
Instead, a much better approach is of course to provide highly detailed guidance - similar to what you would provide a human assistant if they were to design your dashboard.
As evident, the result looks 'as intended' - and more importantly, when we run this 10x (in new conversations each time), we get a 90%+ consistent dashboard each time.
You might argue that writing a prompt like this is also time consuming - but in our experience it is still 5-10 times faster than if we were to construct this dashboard from scratch. For example, notice that many of our message/signal names are 'approximate', leaving Grafana Assistant to figure out what the exact table and column names are. Further, some of the panels involve semi complex queries (e.g. the consumed State of Charge and the delta distance traveled), which would require significant SQL expertise to create.
Most importantly, the prompt specifies no SQL syntax - which is important as 99%+ of our end users have zero SQL experience.
Check out the generated dashboard in our playground:
dashboard playground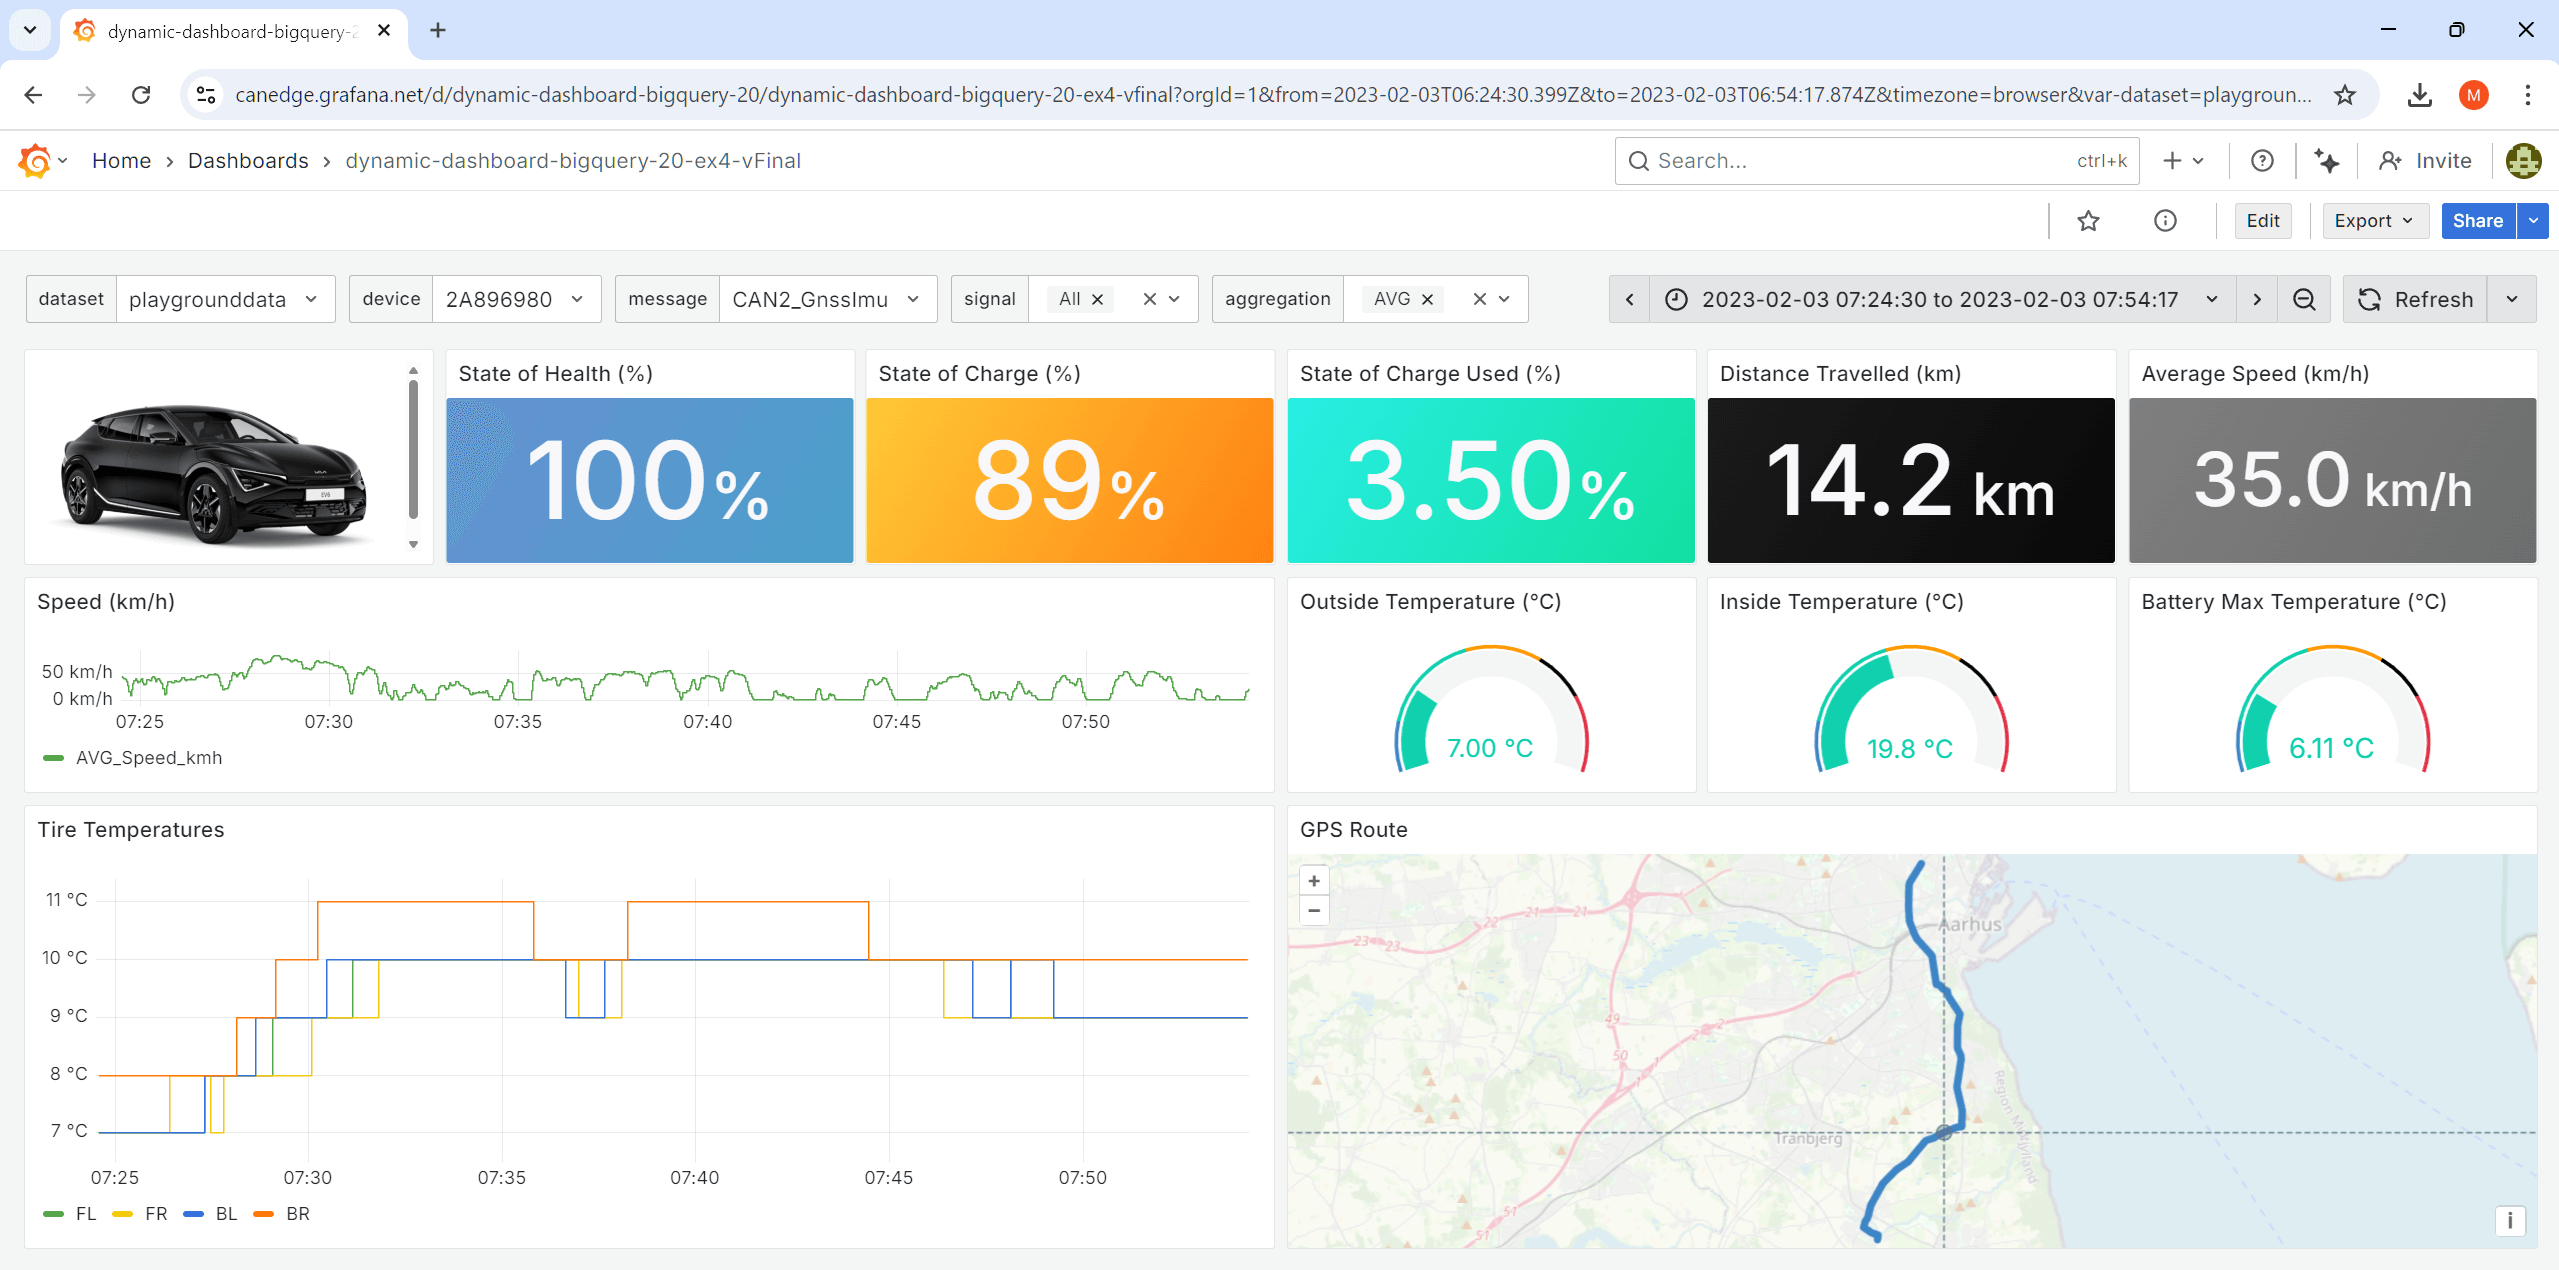 Result: The LLM now produces a consistent dashboard
ready-for-use
Result: The LLM now produces a consistent dashboard
ready-for-use
Ex #5: Create a kWh/100km panel
In our ChatGPT article, we ask the chatbot to calculate the average kWh/100km using three signals: BatteryDCVoltage, BatteryCurrent and Speed. In that article, this is quite simple as the provided CSV dataset is already resampled to a common time raster of 5 seconds across all CAN signals.
In our case, the Parquet data lake that underlies our Grafana integrations is separated by device, CAN channel and CAN message. Each message retains the original time raster used in recording it - i.e. no resampling is applied to the backend data. This is 'the right way' to work with decoded CAN bus data as it allows end users to analyze CAN signals at their original timestamp resolution. However, it also adds complexity when analyzing signals across different CAN messages.
In this example, we attempt to create a kWh/100km panel in two different ways via Grafana Assistant.
Prompt 2: Subsequently we go for a single query
Result 2: The LLM outputs an extensive SQL query to get kWh/100km
5.1: Multiple queries + transformations
One solution is to use multiple queries in a single panel and join/modify the results via transformations as per our 'prompt 1'.
Grafana Assistant manages to do this to an extent and creates two separate queries, joins them via transformations and applies 5-7 additional transformations to generate the end result. However, across 5+ tests we did not manage to get the expected result - e.g. because the LLM struggles with the fact that a 'query suffix' (A, B) must be added to the signal names when transformations are applied.
5.2: Single query
As an alternative, we try to use a single SQL query.
The resulting query works as intended, though the LLM makes a lot of assumptions - some of which we might not agree with (for example, in this particular dataset the BatteryCurrent < 0 filtration should be removed). But overall, this method performs more consistently than the 1st approach.
Ex #6: Convert dashboard SQL syntax
It is common to have a Grafana dashboard with 20+ panels where you need to update all the panels in a non-trivial manner.
In this example, we want to 'migrate' an Amazon Athena dashboard to our Google BigQuery data source - while also fixing various CAN message name changes.
As evident, Grafana Assistant handles this surprisingly well and delivers a 95% correct migration with just the above prompt and a single follow-up from our side.
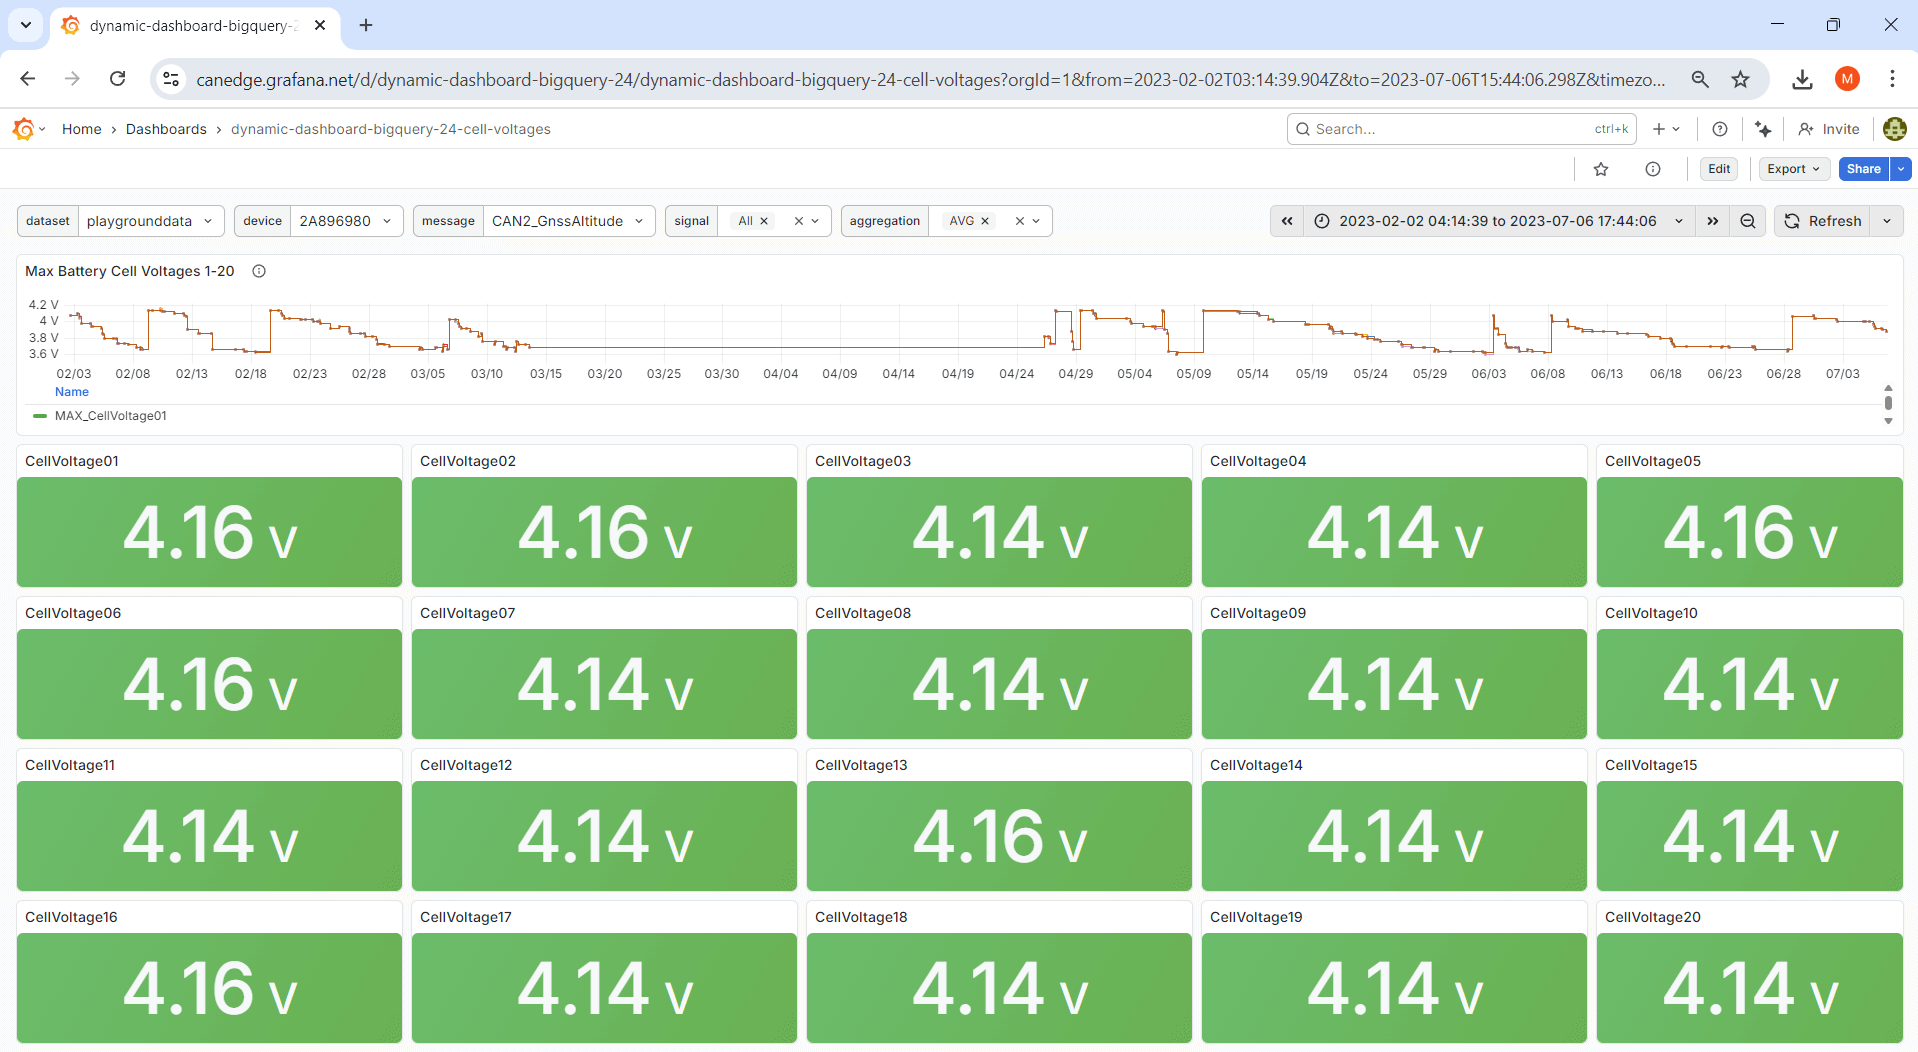
Ex #7: Automate repetitive tasks
Sometimes you need to create a lot of similar dashboard panels in Grafana, which can be both tedious and time consuming. In this example we ask Grafana Assistant to create a dashboard visualizing our electric vehicle battery cell voltages (20 in total), all of which can be queried from a single CAN message.
In this case, the LLM does succeed in producing the expected dashboard as shown in the picture. However, it is unable to use dashboard panels as data source references - and therefore creates a new query in each stat panel, resulting in a total of 21 queries instead of 1 for the dashboard. This is an example of a small limitation with big implications - which we hope gets resolved in the coming months.
Data sources, pricing & security
Grafana Assistant is clearly a highly useful tool - but what about the fine print?
Supported data sources
As outlined, we provide plug & play Grafana integrations across Amazon Athena, Google BigQuery and Azure Synapse.
During our initial tests only BigQuery was supported (hence why this is used in our test showcases), but Grafana Assistant now also has support for Athena.
Synapse relies on the Microsoft SQL Server data source, which is currently not supported by Grafana Assistant at all, meaning the LLM is both unable to modify panels or run queries.

Pricing & rate limits
Grafana Assistant is currently only available in Grafana Cloud, not yet in the self-hosted open source version of Grafana. The tool has rate limits, though we never hit them in our testing.
As of the writing of this article, usage of Grafana Assistant is available in the free cloud tier, which is what 90%+ of our end users use. However, over time the tool may require a pro account. See also Grafana's docs.
Data security
Data security is of course critical to our end users, as e.g. OEM engineers typically work with proprietary and sensitive CAN bus data - see also our article on secure CAN bus telematics.
In this regard, the Grafana docs state that the data is encrypted, access is limited to the Grafana Assistant team and that data is not used for model training or publicity. For details see the docs.
We recommend that you review your company policy before using the LLM with your data.
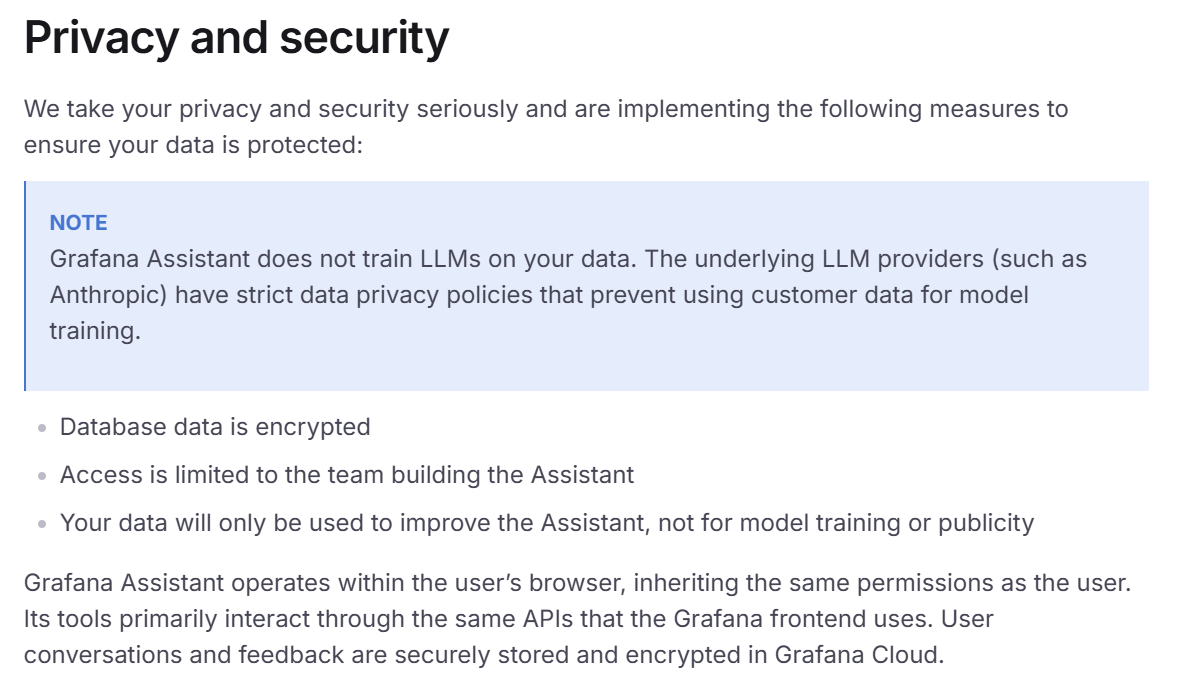 Snippet from the Grafana Assistant docs
4 summary thoughts
We spent 20+ hours with Grafana Assistant in writing this article - below are thoughts:
1: Excellent concept
Since our users have already hooked up Grafana to their Parquet data lake, it is extremely simple to start working with the data through the LLM. This ease-of-access is a critical advantage - and the assistant UI is great.
2: A drunk genius
Grafana Assistant can give you that 'magical experience' where you sit back and watch it produce an entire Grafana dashboard in one shot according to your specifications. However, it can also make mistakes that seem like they belong to LLMs from 2022. We hope this gets more consistent over time.
3: Visualization vs. analysis
The LLM is able to modify dashboards and execute SQL queries, making it an excellent tool for data visualization and light exploration. However, it is not able to run scripts (in contrast to e.g. ChatGPT), making it less suitable for highly complex multi-step data analysis. Make sure to use the right tool for the right job.
4: Huge potential
While the current version has limitations in terms of performance and data source support, we are confident that Grafana Assistant will become an extremely handy tool for data visualization and exploration. In just our one month of testing, Grafana added a ton of improvements to the LLM - so we are excited to see how this tool develops!
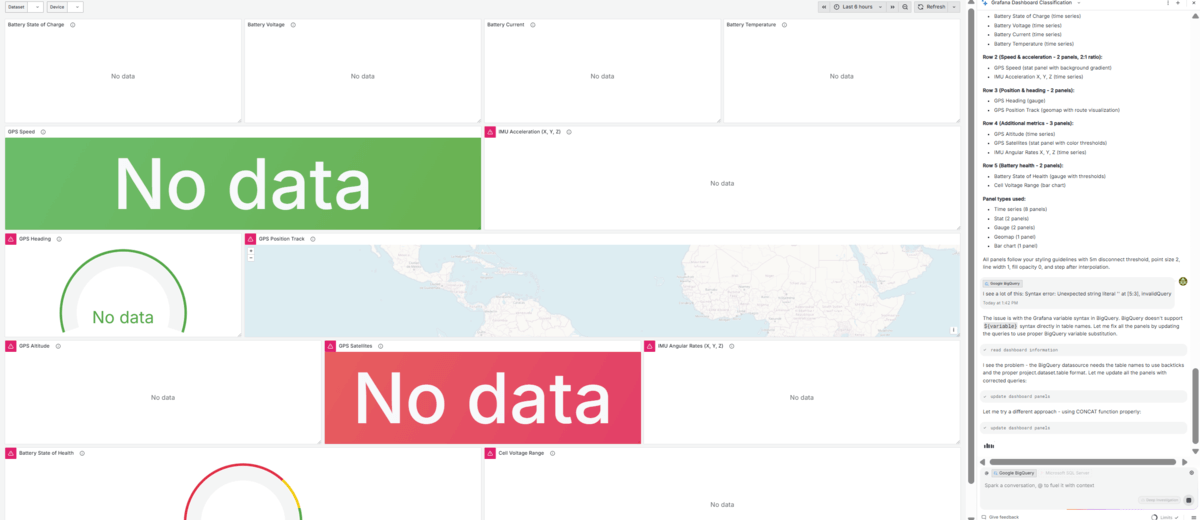 The assistant can at times be frustrating ...
 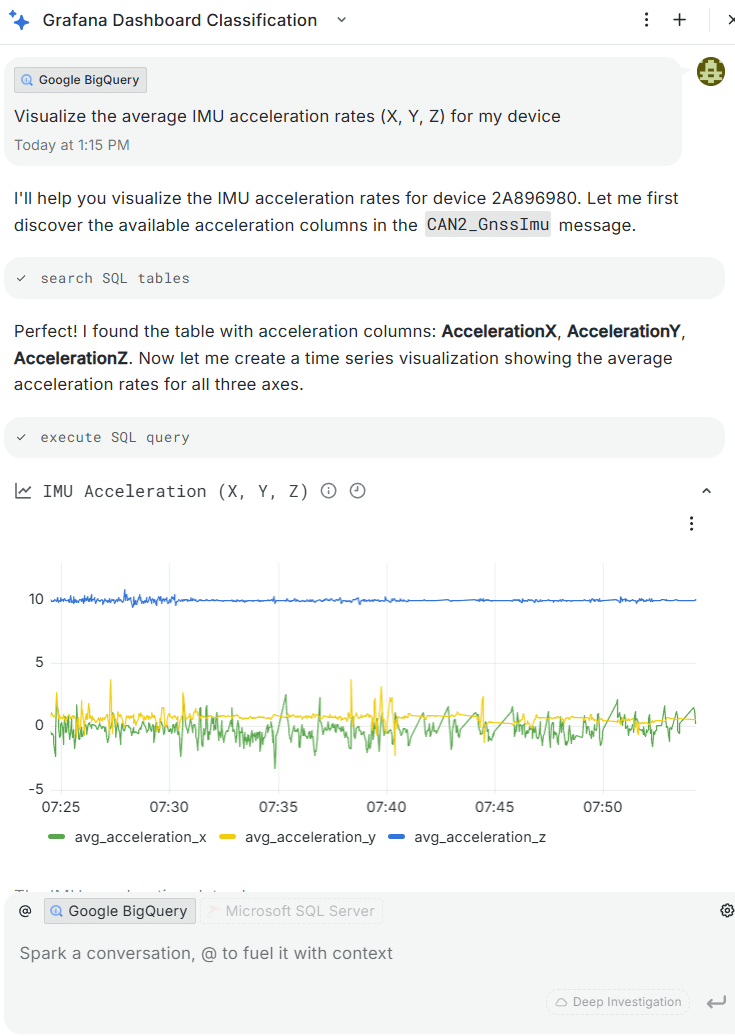 ... but when it works it's excellent
Want to try out Grafana Assistant yourself?
Then use EV data pack and Grafana-Athena / Grafana-BigQuery - or, get a CANedge to analyze/visualize your own CAN bus data!
Ready to visualize your CAN bus data?
Get your CANedge today!