Diagnosing Forestry Equipment CAN Data via asammdf & Grafana
Case Studies / DC Equipment
DC Equipment
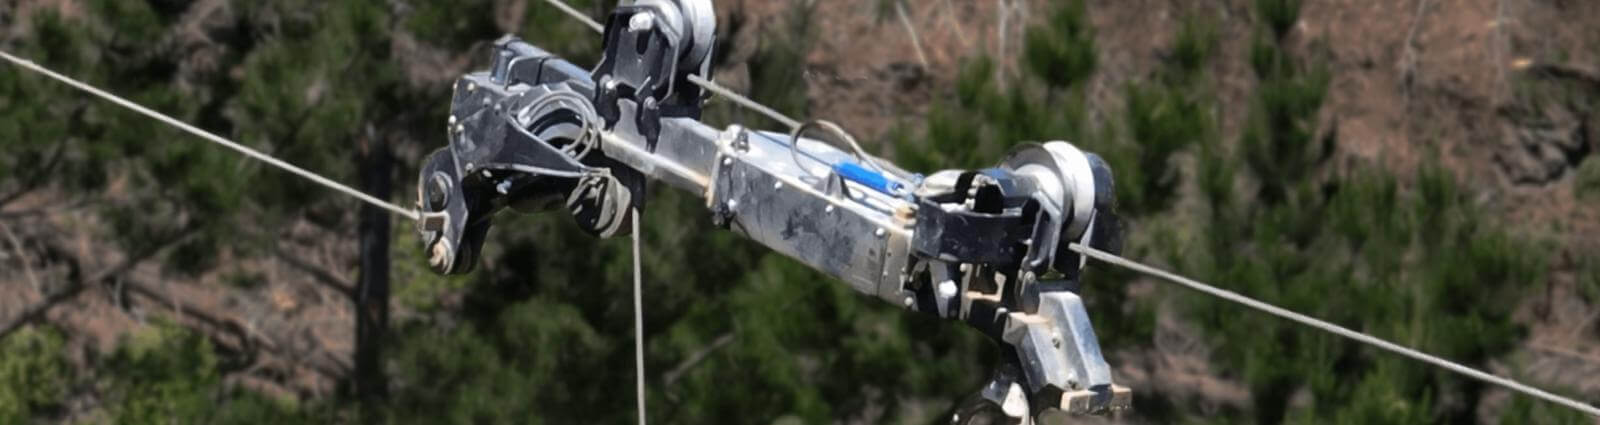
DC Equipment, New Zealand, designs and manufactures mechanised steep slope logging equipment
What problem did you solve?
DC Equipment design, develop and test numerous prototypes of equipment targeting the forestry industry. Each prototype contains a mixture of mechanical, electrical and hydraulic components. Our testing is conducted both in-office, in the workshop and in the forest. The result of testing is to inform the design team of lessons learnt that can help shape decisions when creating a manufacturing-ready product. We needed a more streamlined and less manually-intensive process to help our engineers decipher their data and make decisions, changes and adjustments.
How did you solve it?
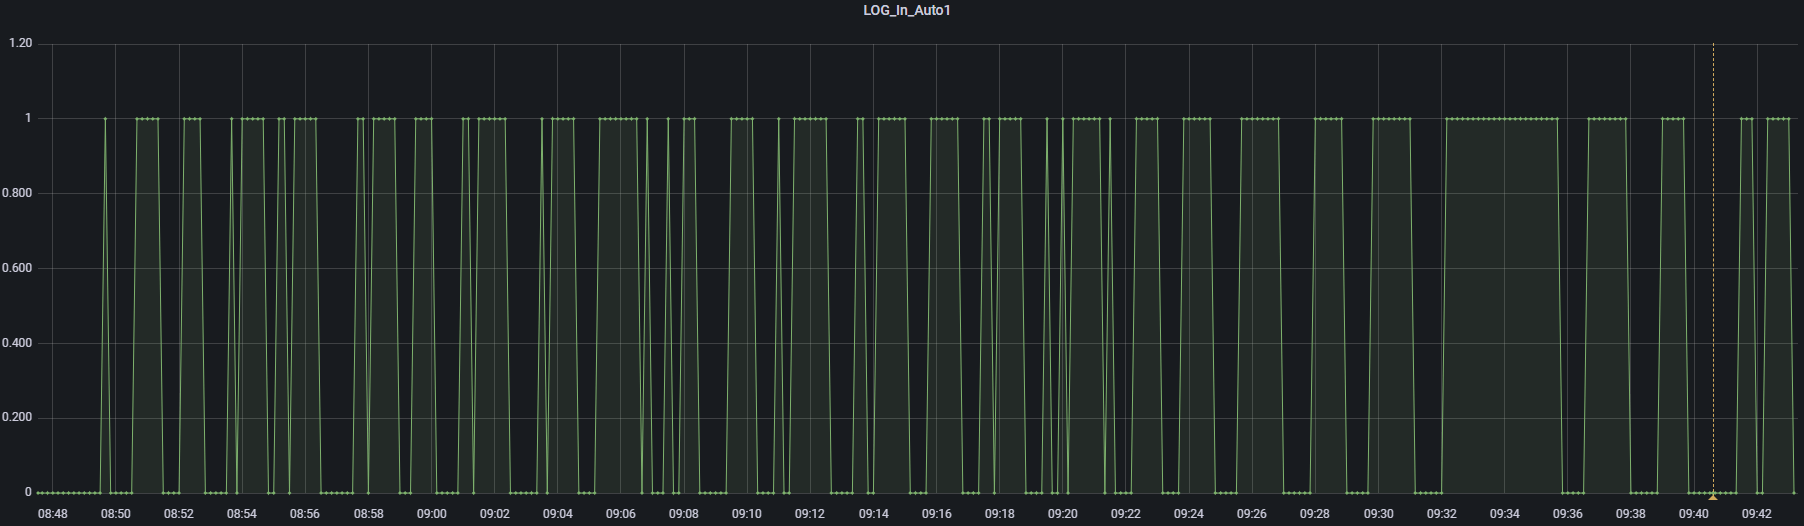
Using a DBC editor, we developed multiple simple DBC files to decode our CAN data logged from PLCs. We used both the asammdf GUI tool and the locally installed Grafana Backend integration to DBC decode and analyze the recorded data. Both setups were used as part of a learning exercise in how each would function, particularly in real-world environments. A key limiting factor of our in-forest test environment is often the lack of cellular connectivity, so tools that are quick and locally available on a laptop are very handy. With the CANedge and these tools, we can operate the prototype equipment in the forest and download the data from the SD card for data processing. Visualising the data in both asammdf/Grafana was possible within minutes, providing insights into hydraulic pressures, system state variables, inputs and outputs, RPM and other metrics.

"The CANedge2 has been really helpful in diagnosing issues so far - in fact I would say it has truly revolutionised our ability to see data from our prototypes"

What benefit has this led to?
Previous approaches to data logging and decoding of resultant signals were performed using standard office-based tools. This was time-consuming and generally varied in terms of success. Our previous solutions presented various limitations, including limiting the possible data sampling rate and data quantity, while making it far more time consuming to process the data. Using the CANedge and related software tools, we were able to maintain a high frequency of data sampling of numerous signals - as well as decode these quickly to gain insights. Further, all of this can now be accomplished within a fraction of the time compared to our previous methods. In turn, this helps our team make design decisions much more quickly.
Why did you choose the CANedge2?
We use the CANEdge2 to decode and decipher critical engineering signals as part of our research and development process. We needed multiple features: A real-time clock, easy mounting/extraction between prototypes, optional WiFi/cellular connectivity and the robustness to handle real-world forestry operations during testing. The device has provided a highly efficient mechanism for recording data from our prototypes. The advice and guidance from the CSS Electronics staff has also helped tremendously.
— David Alderson, R&D Data Systems Developer
Ready to collect your CAN data?
Get your CANedge2 today!


